


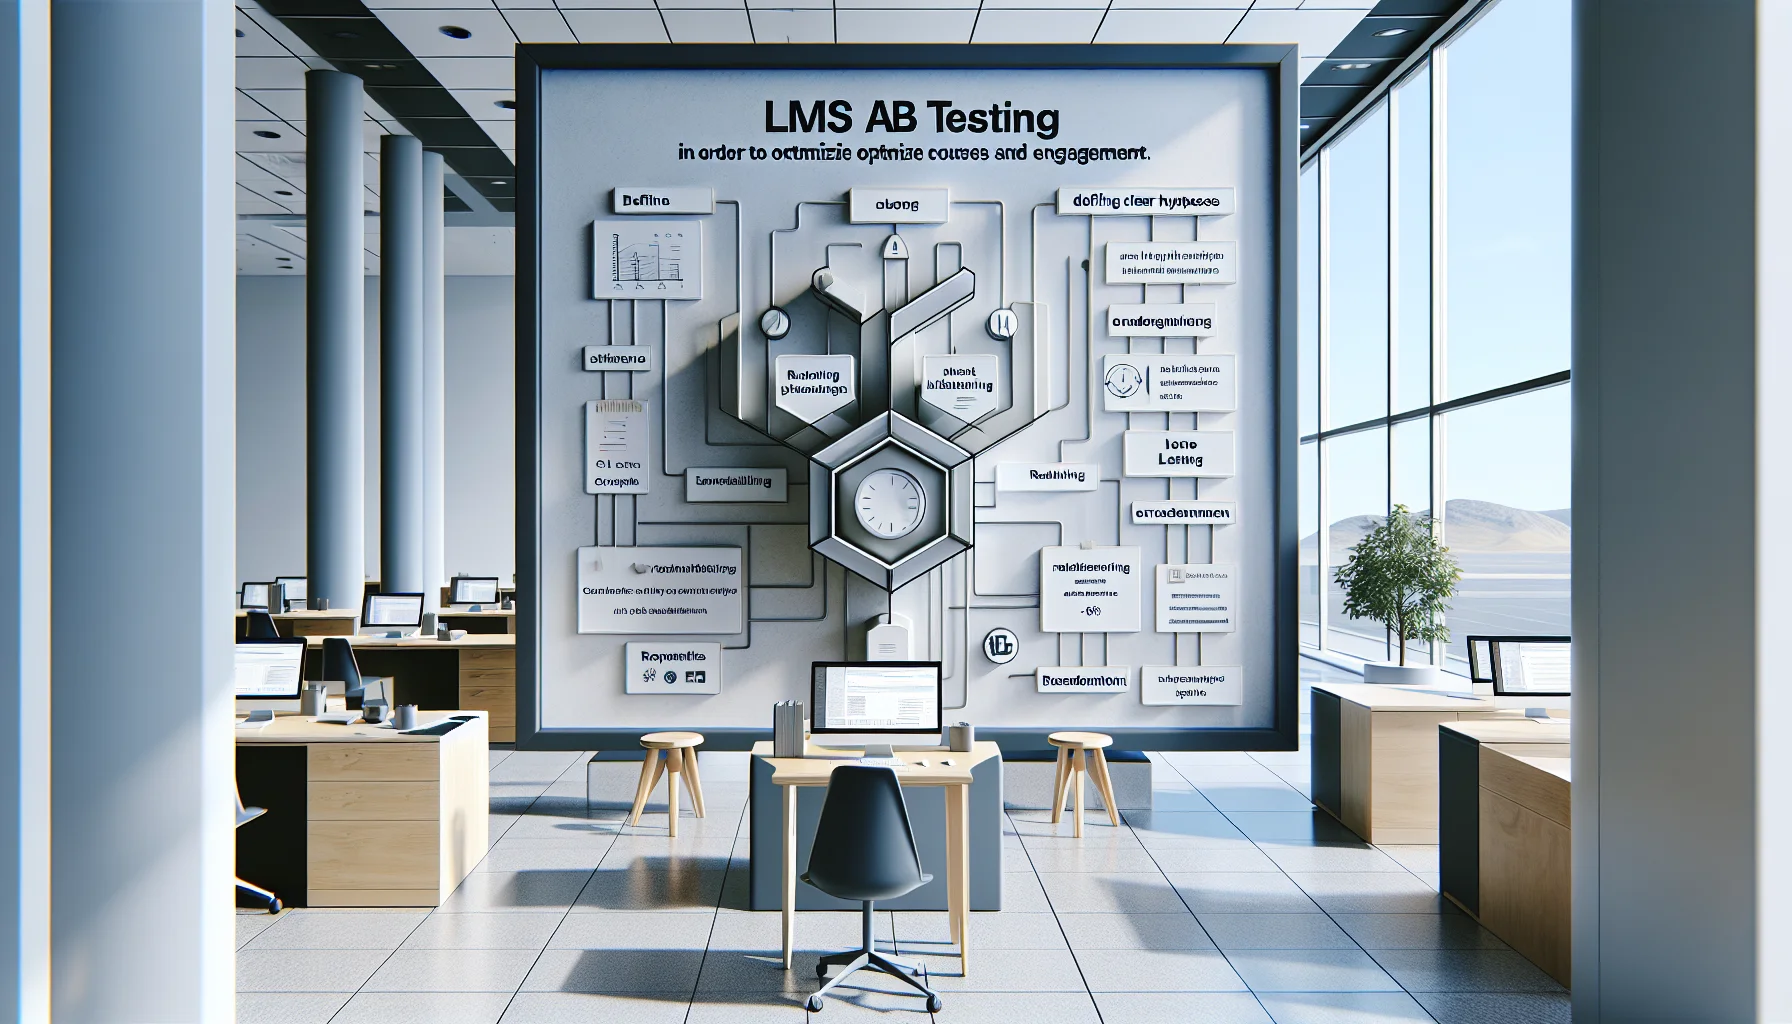
This article shows how A/B testing LMS experiments reduce shelfware by testing titles, module length, and CTAs. It gives hypothesis-driven test plans, metric hierarchies, sample sizes, and case studies (headline lift 28%; microlearning completion up from 12% to 38%). Use the template and steps to run repeatable split tests in your LMS.
A/B testing LMS experiments are a practical way to convert dormant content into measurable value. In the first 60 words it's important to state that A/B testing LMS methods target engagement levers—titles, length, CTAs—to stop courses from becoming shelfware. This article explains a hypothesis-driven approach, provides sample test plans and metrics, and shows how to run repeatable split tests that optimize learner outcomes.
We write from hands-on experience: we've run dozens of experiments in learning to refine course design, and we've found that focused experiments cut shelfware by revealing what learners actually use.
Shelfware appears when courses are published without evidence they meet learners' needs. Common causes include poor discovery cues, long modules, unclear CTAs, and assumptions about job relevance. Using A/B testing LMS methods lets teams replace assumptions with data by running an experiment in learning that isolates one change at a time.
In our experience, the quickest wins are not always content rewrites but microchanges that improve consumption. For example, a change in headline or a shorter module often increases enrollment and completion more than a complete redesign.
Key gains from split testing courses:
Good A/B tests start with a clear hypothesis. A hypothesis-driven experiment in learning states the change, the expected outcome, and the metric you will use. Examples of high-impact hypotheses focus on title, length, and CTA.
Below are three compact test ideas you can run in any LMS that supports split testing.
Hypothesis: Changing the course title to emphasize a practical outcome (e.g., "Save 2 hrs/week with X" vs "Intro to X") will increase enrollments by 12%.
Test plan: Randomly assign visitors to two versions of the course card. Track enrollments and first-module starts for 2–4 weeks. This is a classic A/B testing LMS example that focuses on discoverability rather than content.
Hypothesis: Splitting a 45-minute module into three 15-minute micromodules will increase completion rate by 20% while maintaining learning outcomes.
Measure completion, time-on-task, and post-module assessment scores. This split testing courses approach isolates delivery format without changing learning objectives.
Small CTA wording changes can change behavior dramatically. Set up a three-variant experiment and treat the CTA click-through and conversion to enrollment as your primary metric. Use micro-conversions (preview plays) as secondary checks.
To run A/B tests in your LMS, follow a repeatable workflow. Below are the essential steps that turn an idea into evidence:
Tools and limitations: Many LMS platforms support basic split testing but lack advanced analytics. You may need to export data to a BI tool or use an external A/B platform to measure significance. When tools limit randomization or tracking, implement server-side splits or UTM-based grouping for reliable measurement.
Choosing the right metrics prevents misleading wins. Use a hierarchy of outcomes:
Understanding statistical significance is essential. Here are practical rules we've used:
Short primer: a result is statistically significant when the observed difference is unlikely to be due to chance given your alpha. Beware of peeking at data; use fixed-horizon analysis or sequential methods to avoid false positives.
Here's a simple A/B testing LMS template you can copy:
While traditional systems require constant manual setup for learning paths, modern tools—Upscend is an example—automate role-based sequencing which reduces configuration overhead and lets teams focus A/B testing LMS efforts on content variables rather than delivery plumbing.
Concrete examples help teams move from theory to practice. Here are two case studies we've executed that demonstrate measurable impact.
Situation: A compliance refresher course had low enrollments despite high relevance. We ran an A/B testing LMS experiment swapping the course card title from "Annual Compliance Refresher" to "Complete Compliance in 15 Minutes — Save Time on Year-End Audits."
Result: The new headline produced a 28% lift in enrollments and a 15% lift in first-module starts; completion rates held steady. The lesson: headline specificity and an outcome promise beat generic labels for discoverability.
Situation: A 40-minute technical module had a 12% completion rate. We tested a three-part microlearning variant and an unchanged control.
Result: The microlearning path increased completion to 38% and improved quiz pass rates by 6 percentage points. This A/B testing example for course design shows format matters as much as content.
Teams often run into the same blockers when implementing A/B testing LMS programs. Recognize these early to avoid wasted effort.
Small sample sizes: Many internal LMS populations are small. If you can't reach required N, consider within-subject designs, longer test durations, or aggregating similar courses to increase power.
Tool limitations: Some LMSs don't support random assignment or consistent tracking. Use consistent tags/UTMs, server-side routing, or export events to a data warehouse for analysis.
Over-testing & significance hunting: Running many tests increases false positives. Prioritize hypotheses with the largest expected impact and keep experiments orthogonal.
Checklist to scale responsibly:
A/B testing LMS is not a one-off tactic; it's a systematic way to fight shelfware by proving what learners prefer and benefit from. Start with small, well-scoped hypothesis-driven tests focused on titles, length, and CTAs, use clear primary metrics, and require statistical rigor before scaling changes across catalogs.
Immediate next steps:
If you want a simple starting exercise: pick a course with low starts, craft a results-focused headline, and run an A/B testing LMS split for two weeks. Track enrollments and starts, apply the template, and document the outcome — you'll learn more in two weeks than from months of guessing.
Call to action: Export two weeks of baseline enrollment data now, pick one course, and run a headline A/B test using the template above to immediately reduce shelfware and inform your content roadmap.
The Upscend Team provides actionable insights on technology and business strategy.
Book a walkthrough and we'll show you how it applies to your own content.
 General
December 22, 2025
Actionable steps for running LMS A/B testing: define clear hypotheses, randomize assignment, and track primary metrics like completion and retention. The article explains sample-size rules, analysis checks, implementation options (native LMS or API/LTI), and offers practical test ideas and a checklist to avoid common pitfalls.
 Business Strategy&Lms Tech
December 31, 2025
This article gives a practical framework for A/B testing LMS course content and pricing, including hypothesis design, cohort assignment, sample-size calculation, and metric hierarchy. It provides two ready templates (content sequencing and tiered pricing), tooling advice for LMS-native and external platforms, and strategies for low traffic and contamination.
 HR & People Analytics Insights
January 6, 2026
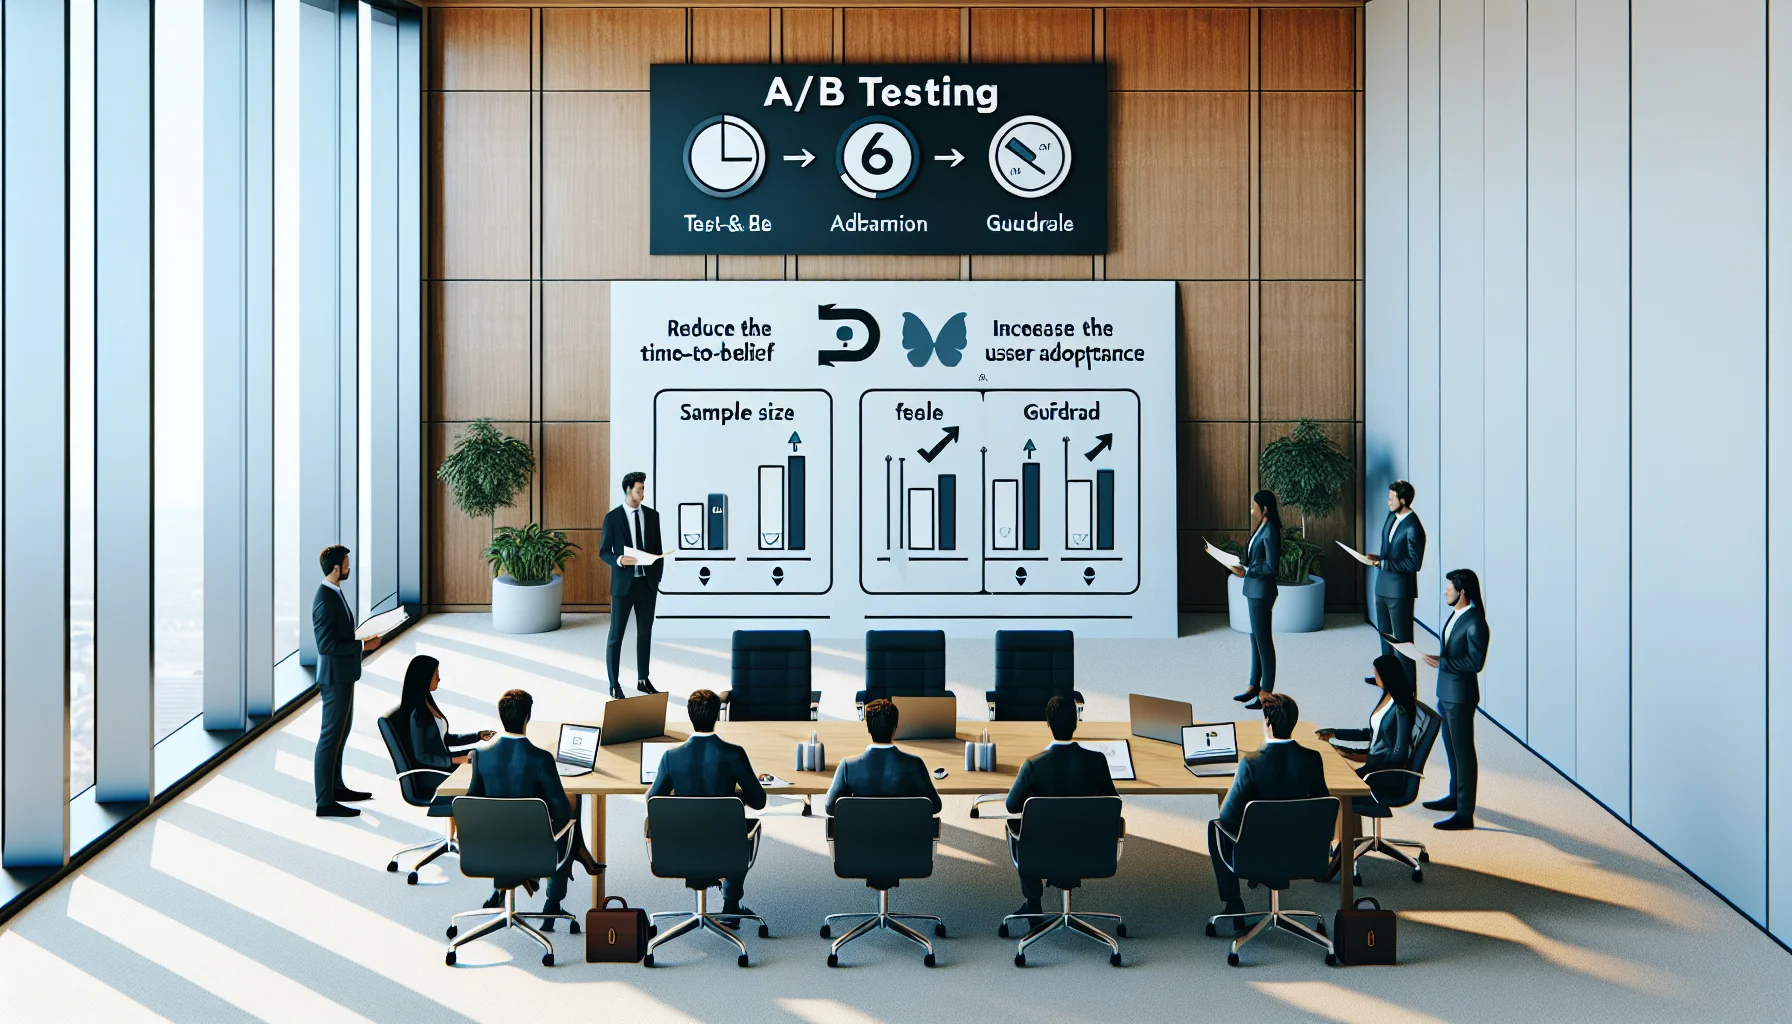
This article shows how A/B testing LMS experiments shorten learners' time-to-belief by exposing friction and measuring applied behavior. It outlines experiment design (hypothesis, metrics, sample size), tooling choices, six ready templates, an interpreted example result, and ethical guardrails—so teams can run practical tests and scale winners quickly.
 HR & People Analytics Insights
January 6, 2026
This article presents a practical five-step A/B testing training framework for LMS: hypothesis, metric selection, sample sizing, randomization, and analysis. It prioritizes high-impact tests (email cadence, microlearning), shares sample benchmark lifts (~7–10%), and offers solutions for small samples and implementation complexity to scale learning optimization.