

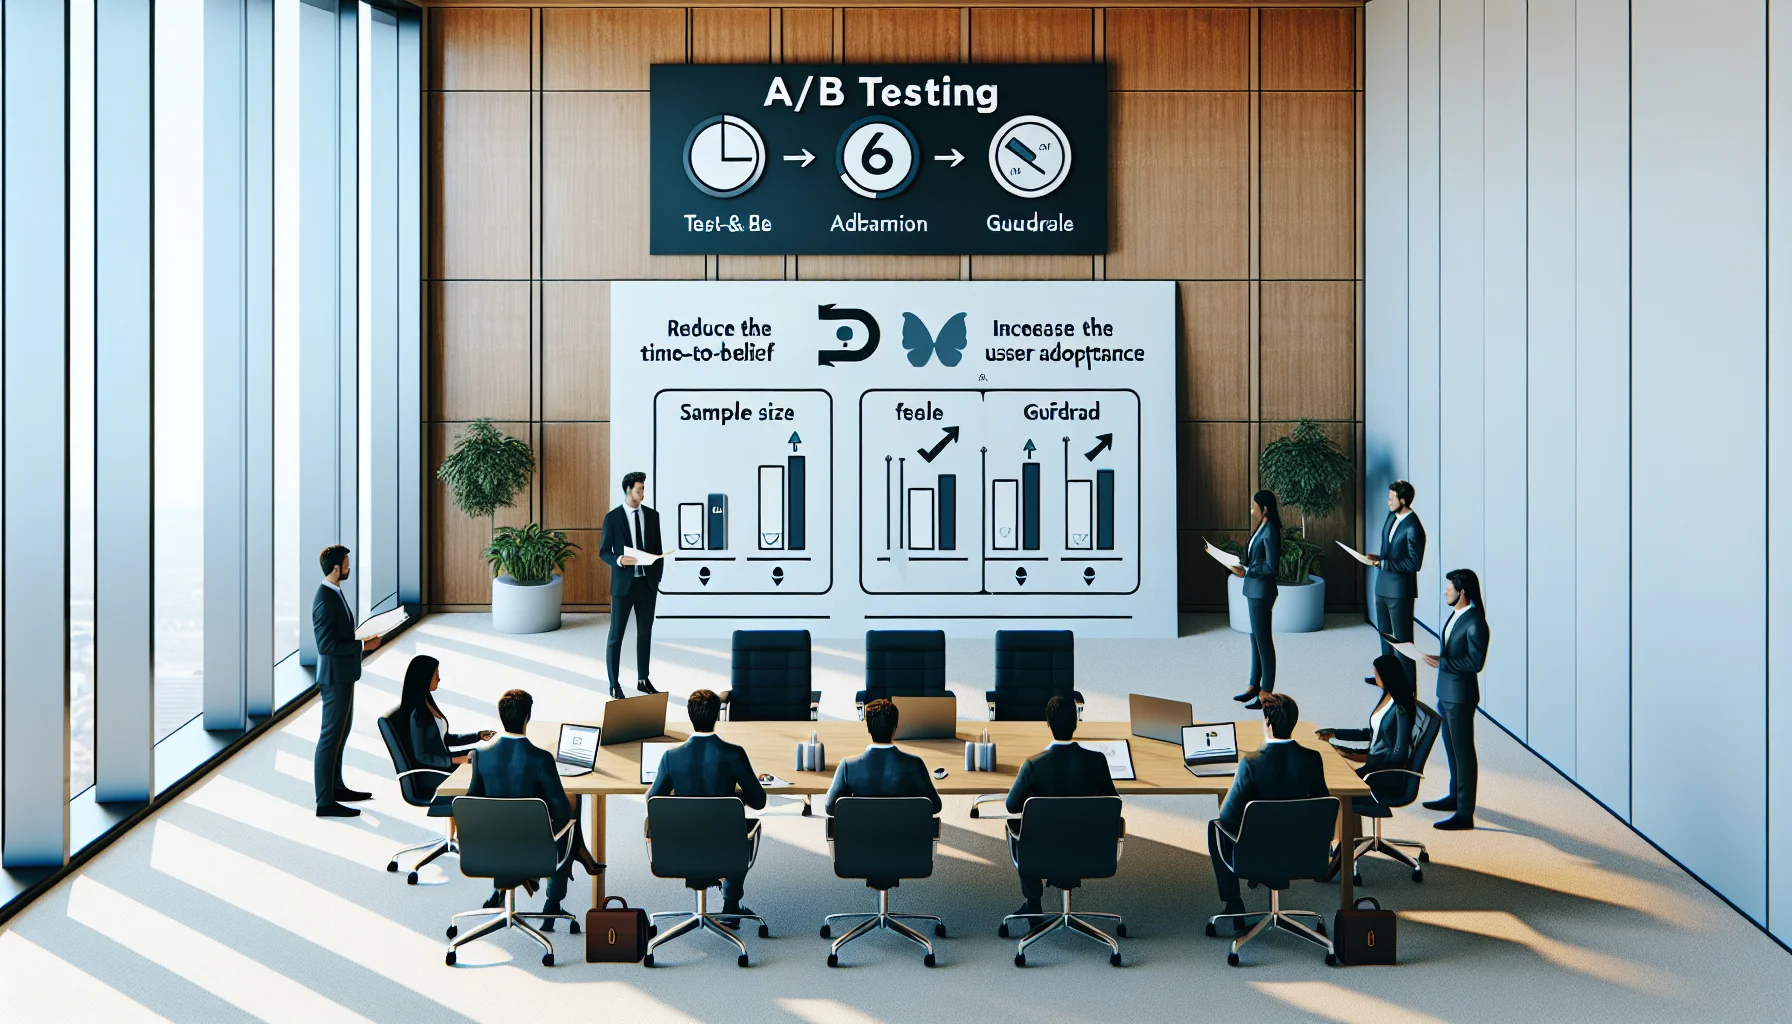
This article shows how A/B testing LMS experiments shorten learners' time-to-belief by exposing friction and measuring applied behavior. It outlines experiment design (hypothesis, metrics, sample size), tooling choices, six ready templates, an interpreted example result, and ethical guardrails—so teams can run practical tests and scale winners quickly.
A/B testing LMS is one of the most practical levers HR and learning teams have to accelerate learner confidence and program adoption. In our experience, running structured experiments inside the learning management system exposes friction points faster than surveys or stakeholder meetings alone. This article explains experiment design, tooling choices, statistical basics, six ready-to-run templates, an interpreted example result, and the ethical and operational guardrails you must use.
Readers will get an actionable checklist for moving from ideas to measurable outcomes and a short set of experiments they can run this quarter to improve adoption and shorten time-to-belief.
Good experimentation starts with a clear problem statement. We begin every test with a concise hypothesis, a primary metric, and an estimate of required sample size. Time-to-belief—how quickly learners trust and apply what they learn—is measurable and can be optimized using controlled comparisons inside your LMS.
Follow a simple framework: state the hypothesis, choose a primary metric, define the sample, randomize assignment, and set a test window. We recommend at least two concurrent cohorts and a holdout population for validation.
Choose metrics that tie to behavior and applied learning rather than vanity numbers. Useful primary and secondary metrics include:
Sample size depends on expected lift and baseline conversion. In our work, a practical approach uses baseline conversion, minimum detectable effect (MDE), desired power (usually 80%), and alpha (typically 0.05). For micro-experiments with conversion outcomes around 20%, a few hundred users per arm is often sufficient; for smaller expected lifts, plan for thousands.
Tools and calculators are available, but always validate assumptions with a pilot cohort before scaling the test across the enterprise.
There are two common approaches to running experiments: using your LMS's native A/B capabilities or integrating an external experimentation platform. Each has trade-offs in fidelity, analytics, and operational overhead.
Built-in tools simplify execution—segment creation, alternate content states, and basic analytics are often available. They reduce engineering effort and keep experiments close to the content lifecycle. However, reporting might be limited and randomization guarantees may be weak.
External tools provide stronger statistical controls, centralized experiment tracking, and richer telemetry. They integrate with LMS via APIs or SCORM/xAPI events. If you need cross-channel attribution or combined experiments (email + LMS), external platforms are preferable.
We’ve found that the turning point for most teams isn’t just creating more content — it’s removing friction. Tools like Upscend help by making analytics and personalization part of the core process.
Below are six templates you can copy and adapt. Each template lists hypothesis, sample size guidance, primary metric, and operational notes. These experiment ideas to reduce time to belief focus on reducing friction and improving early wins.
Hypothesis: Shorter, 10–12 minute micro-modules increase first-week completion and reduce time-to-belief.
Sample: 200–400 learners per arm. Metric: time from enrollment to first competency pass. Notes: keep learning objectives identical; only change format.
Hypothesis: Presenting a clear CTA to "Try an in-app task" immediately after the module increases applied activity within seven days.
Sample: 150–300 per arm. Metric: % who attempt task within 7 days. Notes: randomize CTA placement and A/B test wording.
Hypothesis: Scenario-based assessments yield higher post-course application than multiple-choice knowledge checks.
Sample: 250 per arm. Metric: applied task success rate at 14 days. Notes: ensure scenario difficulty is calibrated to match MCQ cognitive level.
Hypothesis: Learners exposed to peer success stories adopt faster than learners shown expert endorsements.
Sample: 200–500 per arm. Metric: enrollment-to-application median days. Notes: track qualitative feedback too.
Hypothesis: Timed nudges (day 2 and day 5) reduce abandonment and shorten time-to-belief.
Sample: 300 per arm. Metric: completion within 14 days. Notes: test cadence and channel (email vs in-LMS push).
Hypothesis: Personalized, mastery-based paths reduce total time to competency versus linear modules.
Sample: Start small (100–200 per arm) as engineering cost is higher. Metric: days to competency and retention at 30 days. Notes: use external analytics if paths diverge substantially.
Each template is designed to be run as an A/B experiment inside the LMS or via an external test-and-learn lms integration. Ensure proper randomization and pre-specify stopping rules.
We ran a test where the hypothesis was: displaying a 5-minute "apply now" exercise at the end of a module will reduce median time-to-belief by 30% compared with content only. The experiment split 1,200 learners equally across control and treatment with a 14-day observation window.
Results: Treatment group median days-to-application = 4 days; control = 6 days. Conversion (applied task within 14 days) was 48% treatment vs 36% control. Using a two-proportion z-test with alpha=0.05, the difference was statistically significant (p < 0.01) and the absolute lift was 12 percentage points.
Interpretation: The evidence supports the hypothesis: a short applied exercise reduced time-to-belief and improved adoption. We also examined breakouts by role and tenure; the effect was strongest for new hires and front-line roles. This suggests a targeted rollout will maximize ROI.
Experiments affect people. Ethical constraints and operational limits must guide design. We always document consent, ensure no participant is disadvantaged, and avoid withholding required training. When tests touch compliance or safety content, use A/B-like methods only on supportive elements (format, examples) not on essential learning outcomes.
Operationally, watch for contamination (learners sharing variants), seasonality (launches vs quiet periods), and learning decay. If you use external analytics, ensure data governance aligns with HR policies and regional privacy laws.
Checklist for responsible experimentation:
A/B testing LMS experiments are a pragmatic route to shrink time-to-belief and increase adoption. In our experience, teams that combine disciplined experiment design (hypothesis, sample size, metrics), the right tooling, and ethical safeguards generate repeatable learning improvements.
Start with two low-effort templates from the list—content length compression and CTA timing—measure using clear primary metrics, and then scale the winners. Use pre-specified significance thresholds and practical stopping rules to avoid false positives.
Next step: Choose one template to run in the next 30 days and register the test with stakeholders. Track at minimum the primary metric and one business outcome for 30 days post-test.
Call to action: Pick a single hypothesis, define the metric and sample, and run your first controlled LMS experiment this month to begin reducing time-to-belief.
The Upscend Team provides actionable insights on technology and business strategy.
Book a walkthrough and we'll show you how it applies to your own content.
 General
December 22, 2025
Actionable steps for running LMS A/B testing: define clear hypotheses, randomize assignment, and track primary metrics like completion and retention. The article explains sample-size rules, analysis checks, implementation options (native LMS or API/LTI), and offers practical test ideas and a checklist to avoid common pitfalls.
 Lms
LmsDecember 23, 2025
This article explains how lms competency frameworks align learning to measurable outcomes, connect to a shared skills framework, and enable skill gap analysis inside an LMS. It outlines a phased implementation checklist, common pitfalls, and industry examples to help L&D leaders run a 60–90 day pilot and scale competency-based learning.
 HR & People Analytics Insights
January 6, 2026
This article presents a practical five-step A/B testing training framework for LMS: hypothesis, metric selection, sample sizing, randomization, and analysis. It prioritizes high-impact tests (email cadence, microlearning), shares sample benchmark lifts (~7–10%), and offers solutions for small samples and implementation complexity to scale learning optimization.
 Psychology & Behavioral Science
January 12, 2026
A/B testing LMS recommendations helps reduce learner decision fatigue when usage signals (low next-step rates, long browsing) indicate friction. This article covers hypothesis formation, sample-size calculations, primary metrics (next-step selection, time-to-selection), three experiment ideas, and an analysis template to interpret results and avoid false positives.