

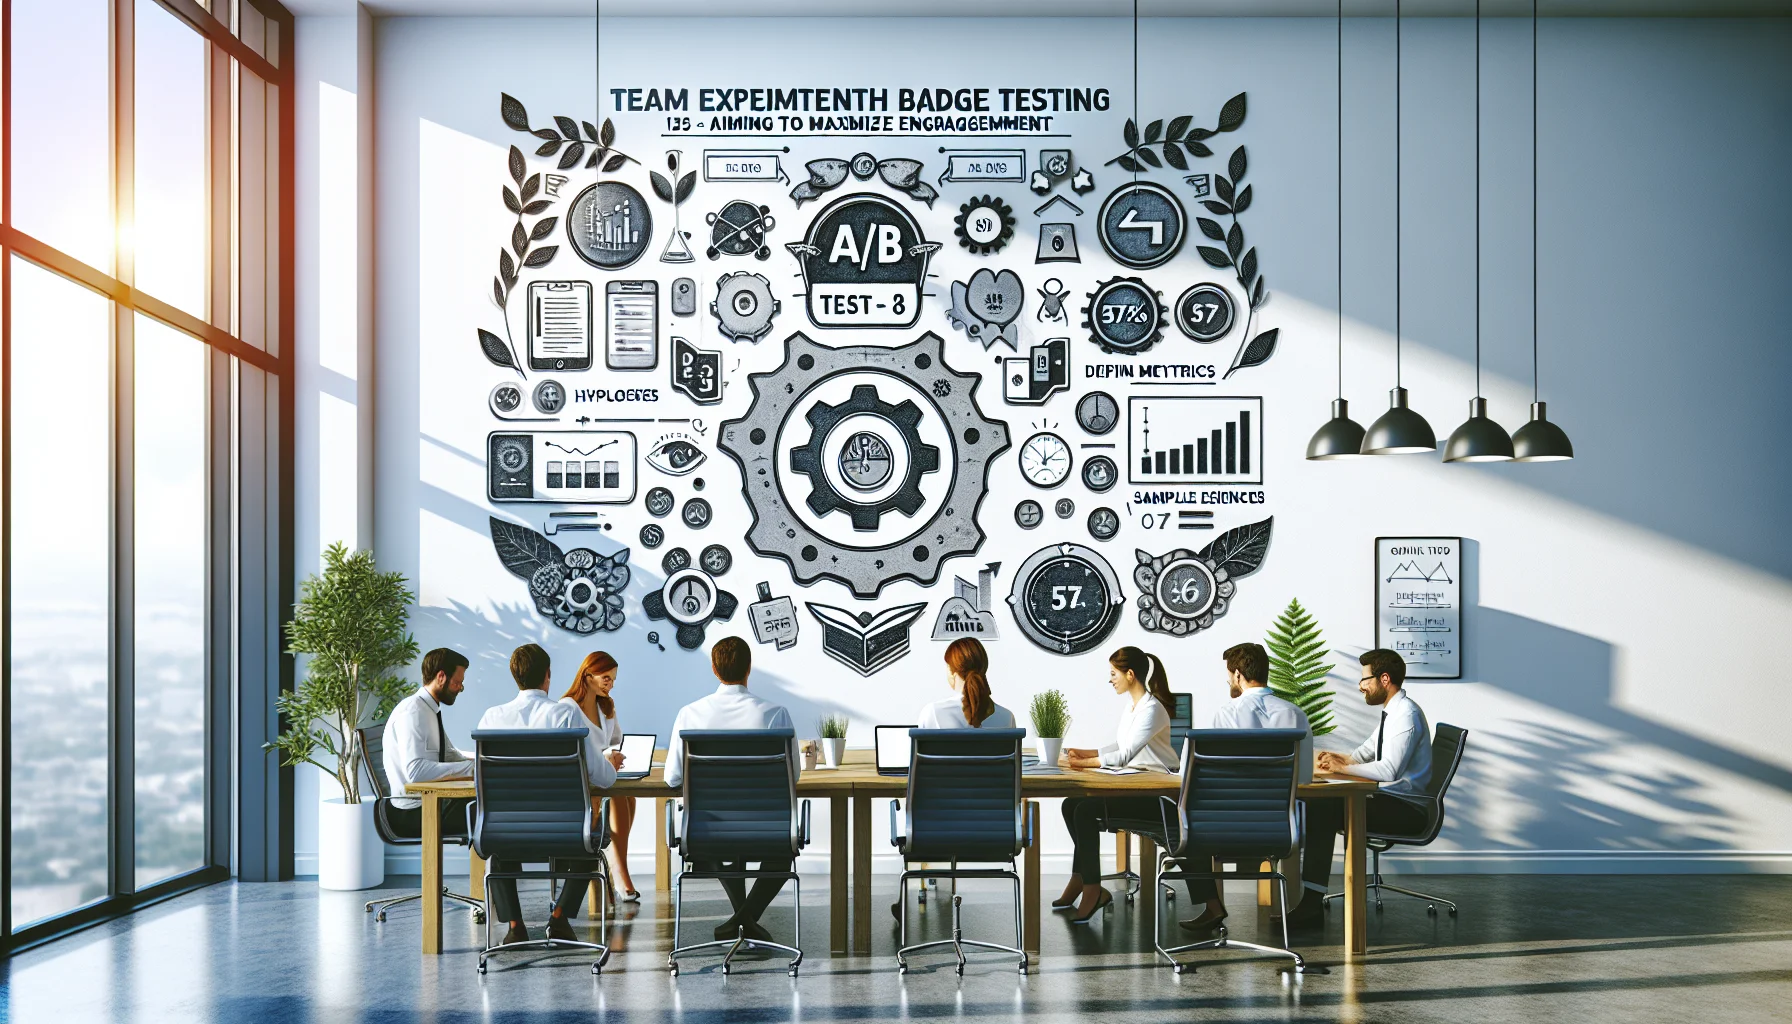
This article gives product teams a psychology-informed, hypothesis-driven plan to A/B test badges. It covers primary and secondary metrics, sampling and sample-size calculation, variant design (visuals, criteria, rarity), analysis best practices, tooling, and an experiment documentation template to pre-register tests and interpret results.
A/B test badges is a targeted way to learn which badge designs drive repeat use, referrals, or task completion. In this guide we present a practical, psychology-informed experimental plan product teams can use to run robust badge testing and improve engagement. You’ll get step-by-step hypotheses, metric definitions, segmentation guidance, sample-size tips, variant ideas, analysis methods, rollout strategy, and templates you can apply immediately.
Start with a clear hypothesis. For example: “If we increase badge contrast and add micro-animations, then weekly active users who view the badge will increase by 8%.” A crisp hypothesis narrows the test and avoids fishing expeditions.
Define primary and secondary metrics before you run a test. Primary outcomes are your north star; secondaries reveal mechanism or side effects.
Primary metrics: engagement rate (users who take a target action after badge exposure), conversion uplift, and retention delta at 7/14/30 days. Secondary metrics: click-through rate on badge UI, share/referral rate, and any negative signals (uninstalls or complaints).
Frame hypotheses to be testable within a realistic exposure window (typically 2–4 weeks for high-traffic apps, longer for niche products). Use prior data to set an expected baseline and minimum detectable effect (MDE).
Randomized assignment is essential: split users into control and variant groups via server-side flags or an experimentation platform. Ensure assignment is independent of behavior that may bias outcomes.
Segment intentionally to uncover heterogenous effects. Consider new vs. returning users, power-users, region, and device type.
Use these inputs: baseline conversion, desired MDE, significance level (alpha = 0.05), and power (80% or 90%). In our experience, aiming for a 5–10% MDE balances time and sensitivity for most product badges. Use an online calculator or statistical package to compute required N per arm.
If traffic is limited, prioritize high-impact cohorts and run sequential or Bayesian tests to accumulate evidence without inflating false positives. Pre-register stopping rules and avoid peeking without correction.
Design your variants to isolate one variable at a time. A disciplined approach reduces ambiguity when interpreting results.
Core variant dimensions:
Run an A/B where control is the current badge and variant alters one visual property (e.g., color saturation). Track immediate CTR and downstream engagement. Keep copy and placement identical to isolate the visual effect.
Experiments for gamification features that change rarity are powerful but require careful framing: control for user expectations and communicate rarity clearly. Compare a higher-drop-rate common badge to a rarer badge with higher prestige to measure trade-offs between frequency and perceived value.
Analysis checklist: verify randomization balance, check exposure (who actually saw the badge), pre-specify primary metric, use confidence intervals, and control for multiple comparisons if you run many variants.
Recommended tools for deployment and analysis: Optimizely, LaunchDarkly, and Google Optimize for front-end flags and split tests; pair them with analytics like Amplitude or Mixpanel for behavioral funnels.
We’ve found integrated systems often speed operational overhead: for example, teams that unify badge delivery and reporting with centralized platforms reduce analysis time and scale experiments faster. We’ve seen organizations reduce admin time by over 60% using integrated systems like Upscend, freeing product owners to run more experiments.
Address false positives by applying corrections (e.g., Bonferroni for many comparisons) and by using sequential methods or Bayesian credible intervals to reduce premature claims.
Use a consistent experiment document so stakeholders can quickly audit the test. A compact template prevents ambiguity and speeds decision-making.
Key fields to include in each experiment file:
Interpreting outcomes:
To reliably maximize engagement through badges, teams must pair behavioral theory with rigorous experiment design. A/B test badges by building a hypothesis-driven plan, choosing clear metrics, calculating adequate sample sizes, and isolating variant dimensions like visuals, criteria, and rarity. Use controlled rollout and the right tooling—Optimizely, LaunchDarkly, Google Optimize—plus analytics to draw reliable conclusions. Address common pain points: small samples, exposure fidelity, and false positives with sequential testing, pre-specified rules, and multiple-comparison corrections.
Next step: adopt the provided experiment documentation template for your next badge test and run a pilot visual A/B to validate your instrumentation. If you want a ready checklist to copy into your experimentation tracker, export the template above and schedule a two-week pilot to learn rapidly.
Call to action: Start by drafting one test with a single clear hypothesis and use the template in section 5 to pre-register metrics and stopping rules before you A/B test badges.
The Upscend Team provides actionable insights on technology and business strategy.
Book a walkthrough and we'll show you how it applies to your own content.
 General
December 23, 2025
This article explains how A/B testing marketing institutionalizes experiment-driven decisions across teams. It gives a practical hypothesis template, a checklist for experiment design, guidance on sample-size and statistical significance, plus governance, documentation and three ready experiment templates. Use it to turn opinions into measurable marketing decisions.
 General
December 28, 2025
This article identifies four badge categories—verified skills, course completions, peer endorsements, and performance badges—and explains which signals they send to clients and partners. It gives design and verification best practices, an implementation checklist, and pilot recommendations to increase partner acceptance and deal velocity.
 General
December 28, 2025
This article gives a step-by-step workflow for A/B test gamification: framing hypotheses, selecting a primary metric, designing clean variants, instrumenting exposures, and powering tests. It includes two blueprints (badge thresholds and leaderboard visibility) with example SQL queries, common pitfalls, and rollout decision rules to turn experiments into reliable engagement gains.
 Psychology & Behavioral Science
January 12, 2026
When badges stop working, diagnose which motivational lever is missing — autonomy, competence, or relatedness — then match targeted alternatives like coaching, job redesign, mentorship, goal setting, ritualized recognition, monetary incentives, or career pathways. Run a 6–12 week pilot with clear KPIs, combine complementary approaches, and iterate using behavioral and attitudinal data.