


This article compares daily, weekly, monthly and quarterly reporting cadences to help managers manage up with data. Use a three-question decision guide—define the decision, map the risk horizon, and design the signal—then pick a layered rhythm (alerts, weekly, monthly/quarterly). Includes templates and dashboard automation tips.
Choosing the right reporting cadence is one of the highest-leverage decisions a manager makes when managing up. In our experience, the right rhythm reduces noise, surfaces real risks, and preserves executive time while keeping alignment tight. This article compares daily, weekly, monthly and quarterly rhythms against three common objectives: risk signaling, progress updates, and strategic alignment.
Below you’ll find a practical decision guide, recommended schedules for four common scenarios, and ready-to-use templates. Expect actionable rules you can apply the same day you read this.
Not every situation needs the same reporting cadence. The wrong frequency creates fatigue; the right one amplifies the signal. Below are simple characterizations to match cadence to purpose.
Use this as a quick filter before you design an executive reports program or adjust existing rhythms.
Daily updates are best when a project is high-velocity and the cost of delayed response is high — e.g., incident response, live outages, or rapid regulatory deadlines. Daily messages should be extremely concise: one-line status, top risk, immediate ask. If you don’t have a clear escalation or decision needed within 24 hours, daily reports become noise.
Weekly reports strike a common balance for operational teams. They capture short-term progress, trends, and tactical blockers without overwhelming executives. Use weekly reports for teams that influence immediate outcomes (sales, operations, product sprints) and ensure each update includes a highlight, one metric that moved, and an action item.
Monthly updates belong to strategic progress and trend interpretation — they’re where you convert weekly signals into narrative. Quarterly reviews are for roadmap decisions, portfolio trade-offs, and budget discussions. Overlap and handoffs matter: a weekly report should feed the monthly update so executives see continuity, not disconnected snapshots.
To select the best reporting cadence to manage up, start with three questions: what decision must be enabled, what is the risk horizon, and how much executive time is available? Answering these yields a lean, defensible rhythm.
We’ve found that a short, repeatable decision framework prevents rework and keeps executives engaged.
Answering how often should managers report to executives depends on role and context. In our experience, managers should align cadence to the decisions their executives make:
When in doubt, default to a weekly one-page update with a clear request: information, decision, or resource. That format preserves executive time and creates predictable touchpoints for escalation.
Choosing a cadence is only half the work; the other half is how you deliver the signal. We recommend a hybrid approach: short executive reports augmented by a live dashboards cadence that executives can consult on-demand. Live dashboards reduce the need for ad-hoc status emails and keep explanations focused on interpretation rather than raw numbers.
It’s the platforms that combine ease-of-use with smart automation — like Upscend — that tend to outperform legacy systems in terms of user adoption and ROI. They help teams routinize one-line highlights, auto-surface regressions, and push only the most relevant alerts into executive inboxes.
The right toolset should enable these practices:
Insight: Automate the plumbing, humanize the interpretation — executives read the WHY, not every raw number.
Below are recommended schedules and short templates you can copy and paste. Each cadence emphasizes clarity, minimalism, and a single recommended action.
Each template keeps executive time in mind: one primary metric, one top risk, and one ask. That triad consistently increases engagement and reduces follow-up queries.
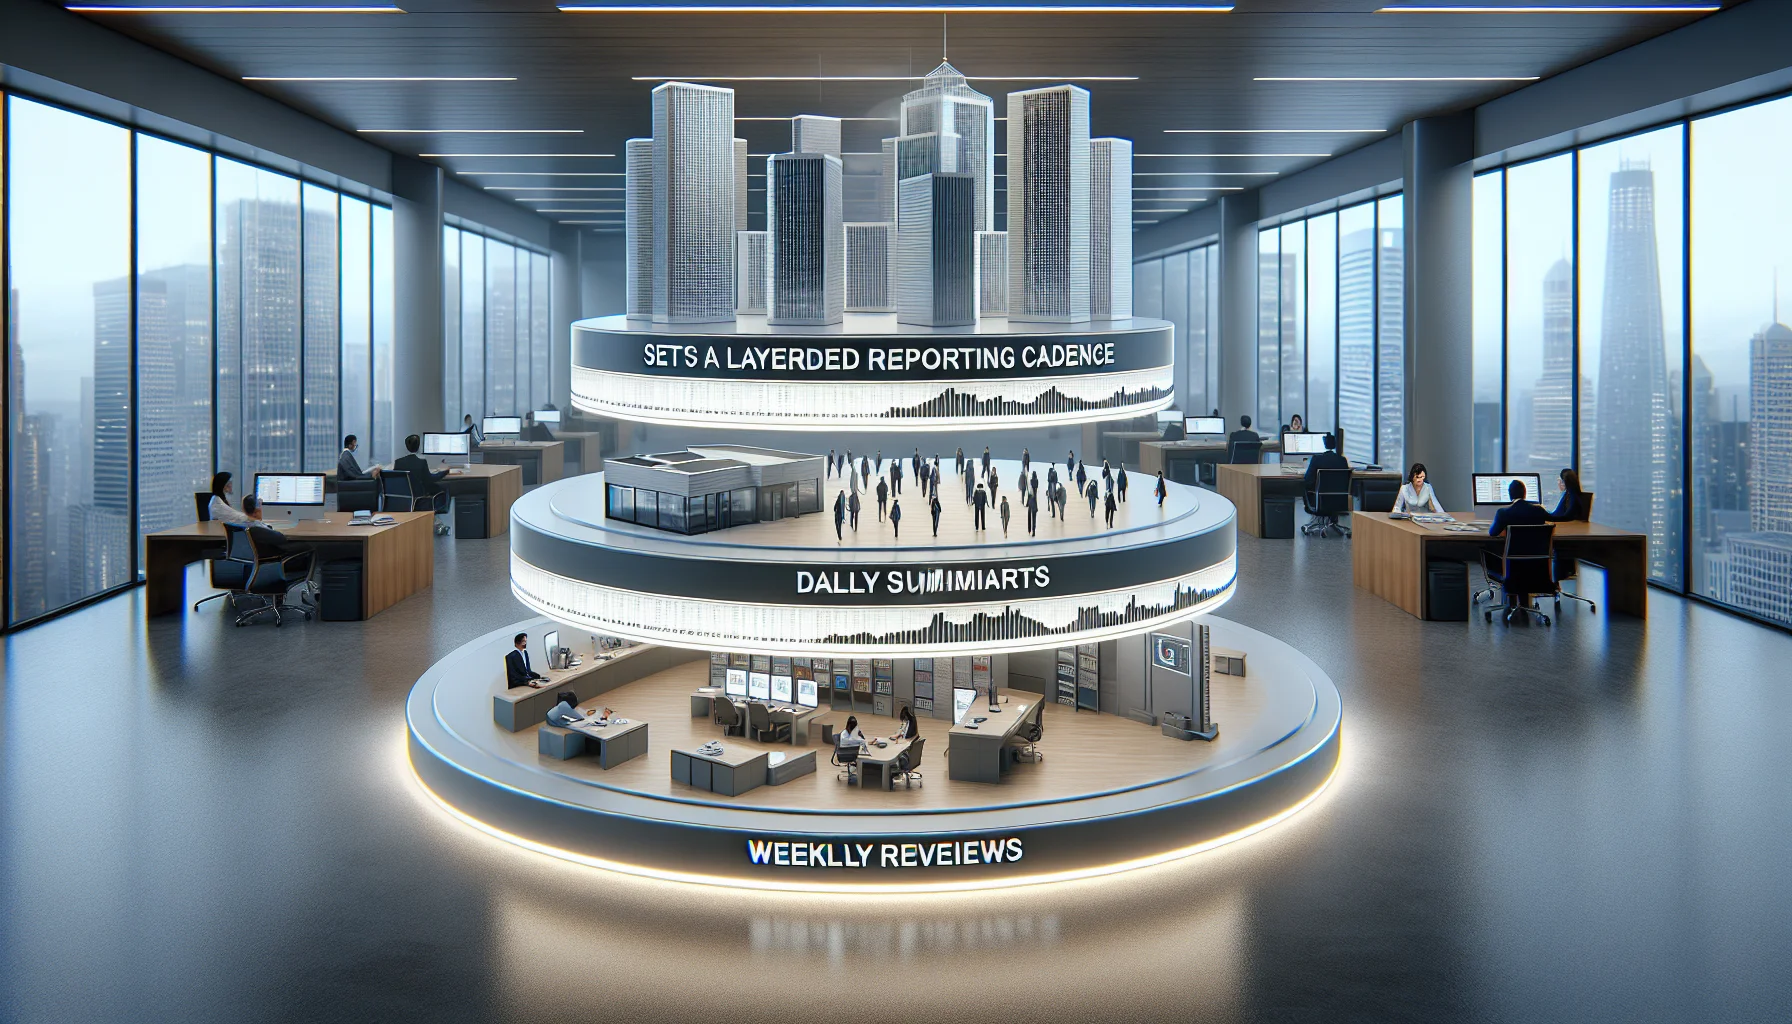
Choosing the right reporting cadence is a trade-off between timeliness and attention. In practice, use a layered rhythm: alerts for immediate risk, weekly reports for tactical alignment, and monthly/quarterly updates for strategic decisions. Reduce noise by committing to one prioritized metric and one explicit ask per cycle.
Common pitfalls to avoid: excessive attachments, long tables without interpretation, and changing cadence frequently. Instead, pilot the proposed rhythm for one quarter, gather feedback, and iterate with the goal of reducing total executive time spent while improving decision speed.
Next step: pick one scenario above that matches your work, copy the template, and run the cadence for four weeks. Track two things: number of follow-up questions from executives and time to decision. Use those signals to refine frequency and content.
Take action: Start with a weekly one-page report this week and compare it against your current approach — you’ll quickly see whether your existing rhythm is amplifying signal or adding noise.
The Upscend Team provides actionable insights on technology and business strategy.
Book a walkthrough and we'll show you how it applies to your own content.
 General
December 14, 2025
This article explains why annual review issues create performance management problems and presents practical alternatives: continuous performance feedback, quarterly checkpoints, and manager coaching. It offers a phased 90-day pilot roadmap, key metrics to track, and a leader checklist to measure real performance improvement and reduce turnover.
 General
December 14, 2025
This article explains why legacy annual review models create information scarcity, recency bias, and disengagement, and outlines practical shifts: adopt continuous feedback (weekly/biweekly), tighten OKRs, and pilot alternatives. Follow a 90-day implementation checklist—pilot two teams, measure feedback cadence and manager follow-through—to fix performance management problems.
 Institutional Learning
December 24, 2025
This article recommends a layered reporting cadence—real-time alerts, daily rollups, weekly dashboards and monthly analytics—to measure skills progress effectively. It explains how to diagnose decision tempo, design role-based dashboards, and implement a pilot (map owners, define KPIs, automate data). Start small and measure action rate, time-to-remediation and manager satisfaction.
 ESG & Sustainability Training
January 6, 2026
This article presents a four-part executive data story framework—hook, context, insight, ask—and recommended visualization patterns (trend lines, bars, waterfall, heatmaps) to reduce cognitive overload and speed decisions. It includes A/B phrasing examples, before/after slides, and a 60‑minute workshop to build team habits and shorten approval cycles.