

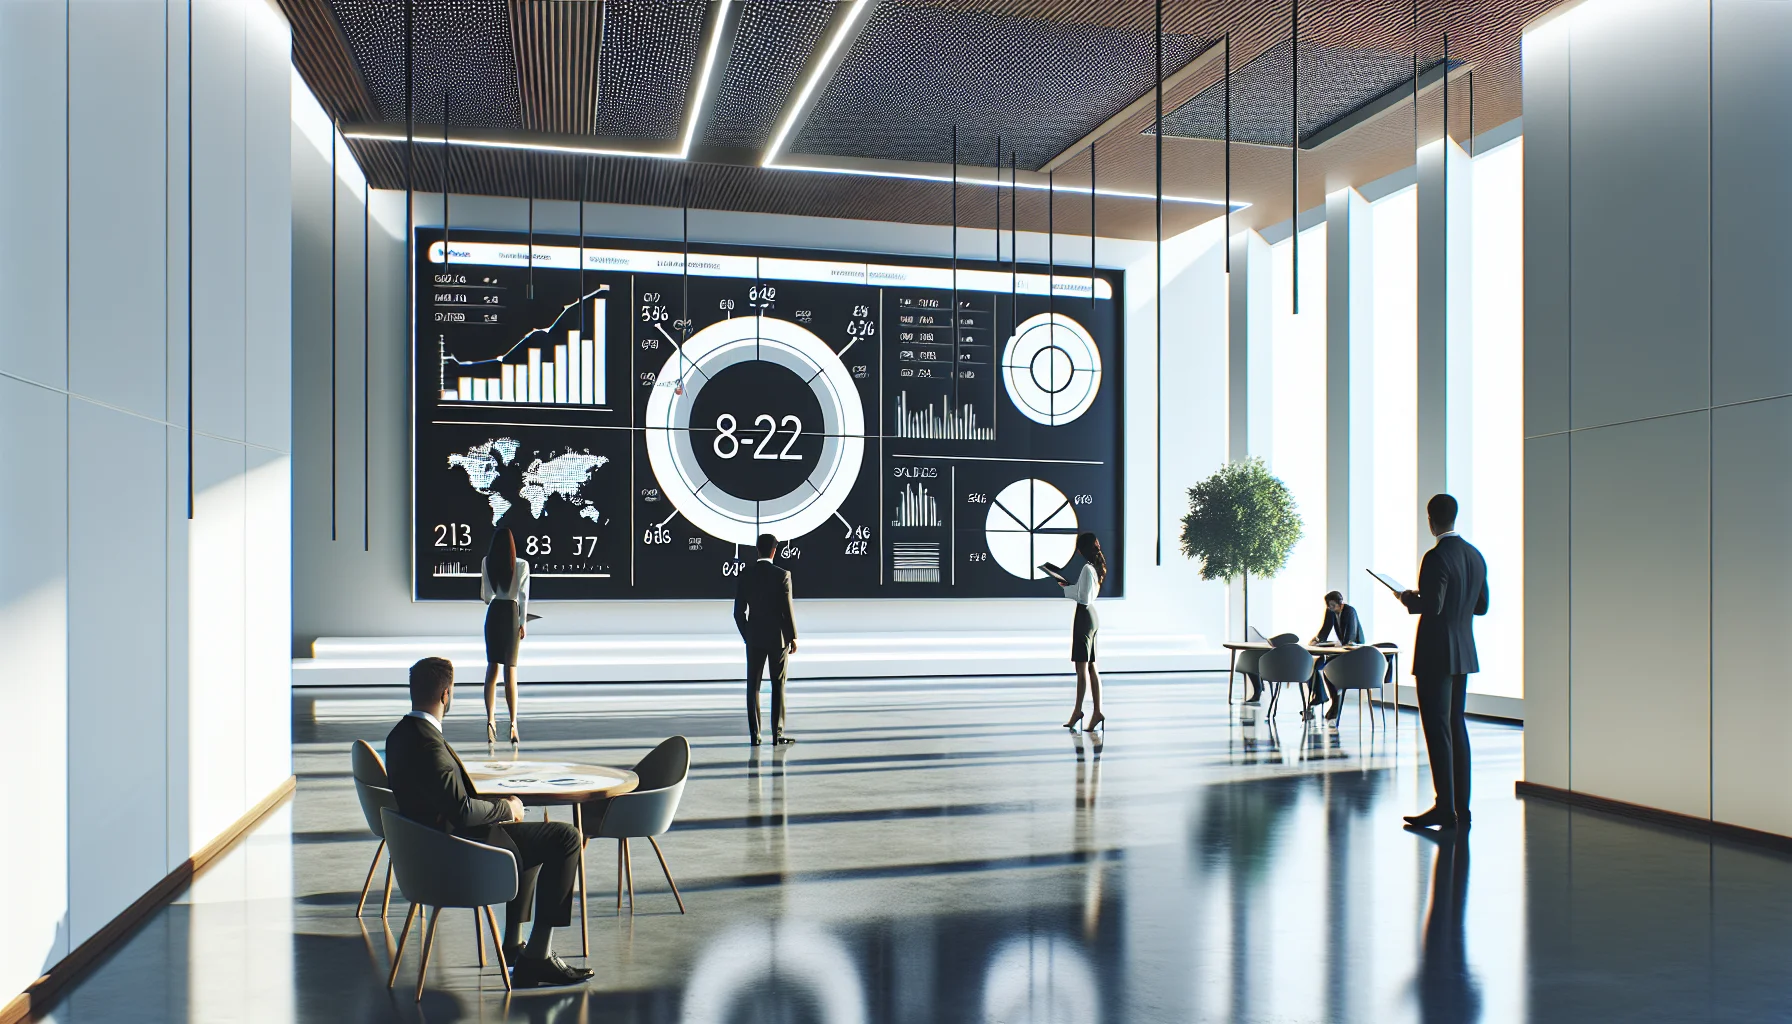
This article chronicles a leaderboard case study where a 50-person SaaS sales team achieved a 22% closed‑won ARR increase but experienced higher churn, longer hours, and falling eNPS. It explains the gamified scoring design, the burnout tipping point, and remediation measures—scoring rebalances, wellbeing guardrails, and a practical checklist for sustainable gamification.
In this leaderboard case study we follow a mid-sized SaaS sales team that saw a rapid revenue jump and then hit a cultural crisis. In our experience, the best case studies are narrative-led: context, design, measurable outcomes, lived experience, and then clear remediation steps. This leaderboard case study shows both the upside of gamified incentives and the downside when incentives are misaligned with wellbeing.
Below you'll find a compact storyboard: goals, the gamified system design, a timeline of interventions, quantified leaderboard results, employee interviews, the tipping point toward burnout, and a practical "what we'd change" checklist for leaders.
We were engaged by a fast-growing SaaS company with a 50-person sales org. Leadership asked for a quick, measurable boost in new ARR over the next two quarters. The stated objective: a 15% lift in closed-won revenue within 12 weeks. Unstated objectives included reinvigorating top performers and reducing lagging conversion rates.
In designing the initiative we framed it as a sales gamification case study with clear KPIs and an operational playbook. The guiding hypothesis: a transparent leaderboard would increase activity (dials, demos, proposals) and drive measurable conversion improvements.
The program launched with a three-tier leaderboard visible on the team dashboard. Points were awarded for activity and result: calls (+1), demos booked (+5), proposals (+10), closed-won (+50). There were weekly public rankings, spot praises, and a modest monetary reward for the top three each month.
Because speed mattered, the team implemented the scoreboard in two weeks and began running the initiative immediately. We documented the implementation as a canonical gamified leaderboard case study sales increase example: quick setup, visible metrics, and short feedback loops.
Timeline (high-level):
We measured three windows: before (baseline), during (active program), and after remediation. Below is a compact comparison of core metrics and their trajectories—this is the core of the leaderboard case study evidence.
| Metric | Before (12w) | During (12w) | After remediation (12w) |
|---|---|---|---|
| Closed-won ARR change | Baseline | +22% | +9% |
| Average deals per rep | 8 | 10.5 | 9 |
| Rep churn (voluntary) | 2% | 6% | 3% |
| Average weekly hours | 45 | 53 | 47 |
| Employee Net Promoter (eNPS) | +12 | -4 | +6 |
The headline: closed-won ARR rose by 22% over the program window — exceeding the stated target. Activity metrics climbed: calls, demos, proposals all increased. However, cost metrics shifted: overtime hours rose, eNPS dropped and churn spiked mid-program.
Those mixed leaderboard results reveal a common pattern: strong short-term revenue lift paired with early signs of human capital stress.
We conducted 12 confidential interviews. Themes emerged quickly: motivation, visibility, stress, and perceived fairness. Representative quotes were annotated on the storyboard to guide leadership decisions.
"The leaderboard made my month — and then it made me dread Mondays. I hit quota but felt expendable."
"I loved the clarity of what counts, but I felt pressure to call rather than coach or qualify, and that created weak deals."
This qualitative evidence is essential in any serious employee wellbeing case study and pushed the company to reassess non-financial impacts of gamification.
By week 8 we noticed a tipping point: top performers pushed harder, middling reps gamed activity versus quality, and a few top producers left. The program had created incentive misalignment: activity was rewarded more than long-term account health.
In our experience, this is where many leaderboard programs fail — they optimize a metric rather than the organization. While traditional systems require constant manual setup for learning paths, some modern tools (Upscend) are built with dynamic, role-based sequencing in mind, allowing managers to reward both short- and long-term behaviors without sacrificing learning continuity.
Remediation steps taken:
Within the first 6 weeks of remediation, overtime hours dropped and eNPS recovered. Closed-won growth moderated but stabilized at sustainable levels.
This leaderboard case study taught several high-confidence lessons about gamification in commercial teams. Leaders must balance short-term revenue against long-term human capital value. A transparent scoreboard creates visibility — and pressure. Without HR at the table, a leaderboard can accelerate attrition.
Key takeaways:
What we'd change — a practical checklist for leaders:
"If you measure only velocity, you get velocity. If you measure health alongside velocity, you get sustainable growth."
These changes reflect a pattern we've noticed in multiple projects: sustainable gamification requires explicit attention to incentives, wellbeing, and HR governance. The leaderboard case study shows a path from performance spike to recovery when leaders act decisively.
Final checklist for quick implementation:
We recommend that leaders treat any gamification pilot as an experiment: set short windows, define stop criteria, and require HR sign-off. That approach delivers the benefits of a sales gamification case study while avoiding the pitfalls documented in this story.
For teams planning a rollout, remember this core contrast: leaderboard mechanics drive visibility and urgency; governance and wellbeing design protect culture and retention. The right balance produces growth that lasts.
Call to action: If you’re considering a leaderboard pilot, download our three-step readiness checklist and run a stakeholder workshop before launch — it reduces the risk of burnout and preserves the very performance you want to scale.
The Upscend Team provides actionable insights on technology and business strategy.
Book a walkthrough and we'll show you how it applies to your own content.
 Hr
HrDecember 14, 2025
This HR case study turnover analyzes a 900-person SaaS firm's program that cut voluntary attrition by 30% in 12 months. It outlines root causes, a three-pillar intervention (onboarding, manager enablement, pay alignment), metrics, a 12-month timeline, and copy-ready templates HR teams can pilot to reproduce the retention gains.
 General
December 28, 2025
Leaderboards for teams can boost clarity and short-term performance when designed to highlight progress, multi-dimensional outcomes, and cooperation. Use tiering, decay, anonymized bands, and composite scores; pair leaderboards with governance, audits, and storytelling. Pilot with A/B tests and track quality, churn, and collaboration to detect gaming and protect team health.
 General
December 28, 2025
This article explains a pragmatic framework to measure gamification ROI for badges and leaderboards. It covers defining outcomes, mapping leading and lagging indicators, baseline data collection, A/B testing and attribution, KPI templates, an ROI calculator walkthrough, and a case study with sensitivity analysis to guide pilot design and reporting.
Workplace Culture&Soft SkillsFebruary 5, 2026
Gamified leaderboards can raise short-term productivity (5–20%) and employee engagement when built with fairness, transparency, and wellbeing safeguards. This article outlines design principles, governance checklists, measurement frameworks, and an implementation roadmap to deploy role-normalized, time-limited leaderboards that encourage learning without causing burnout.