

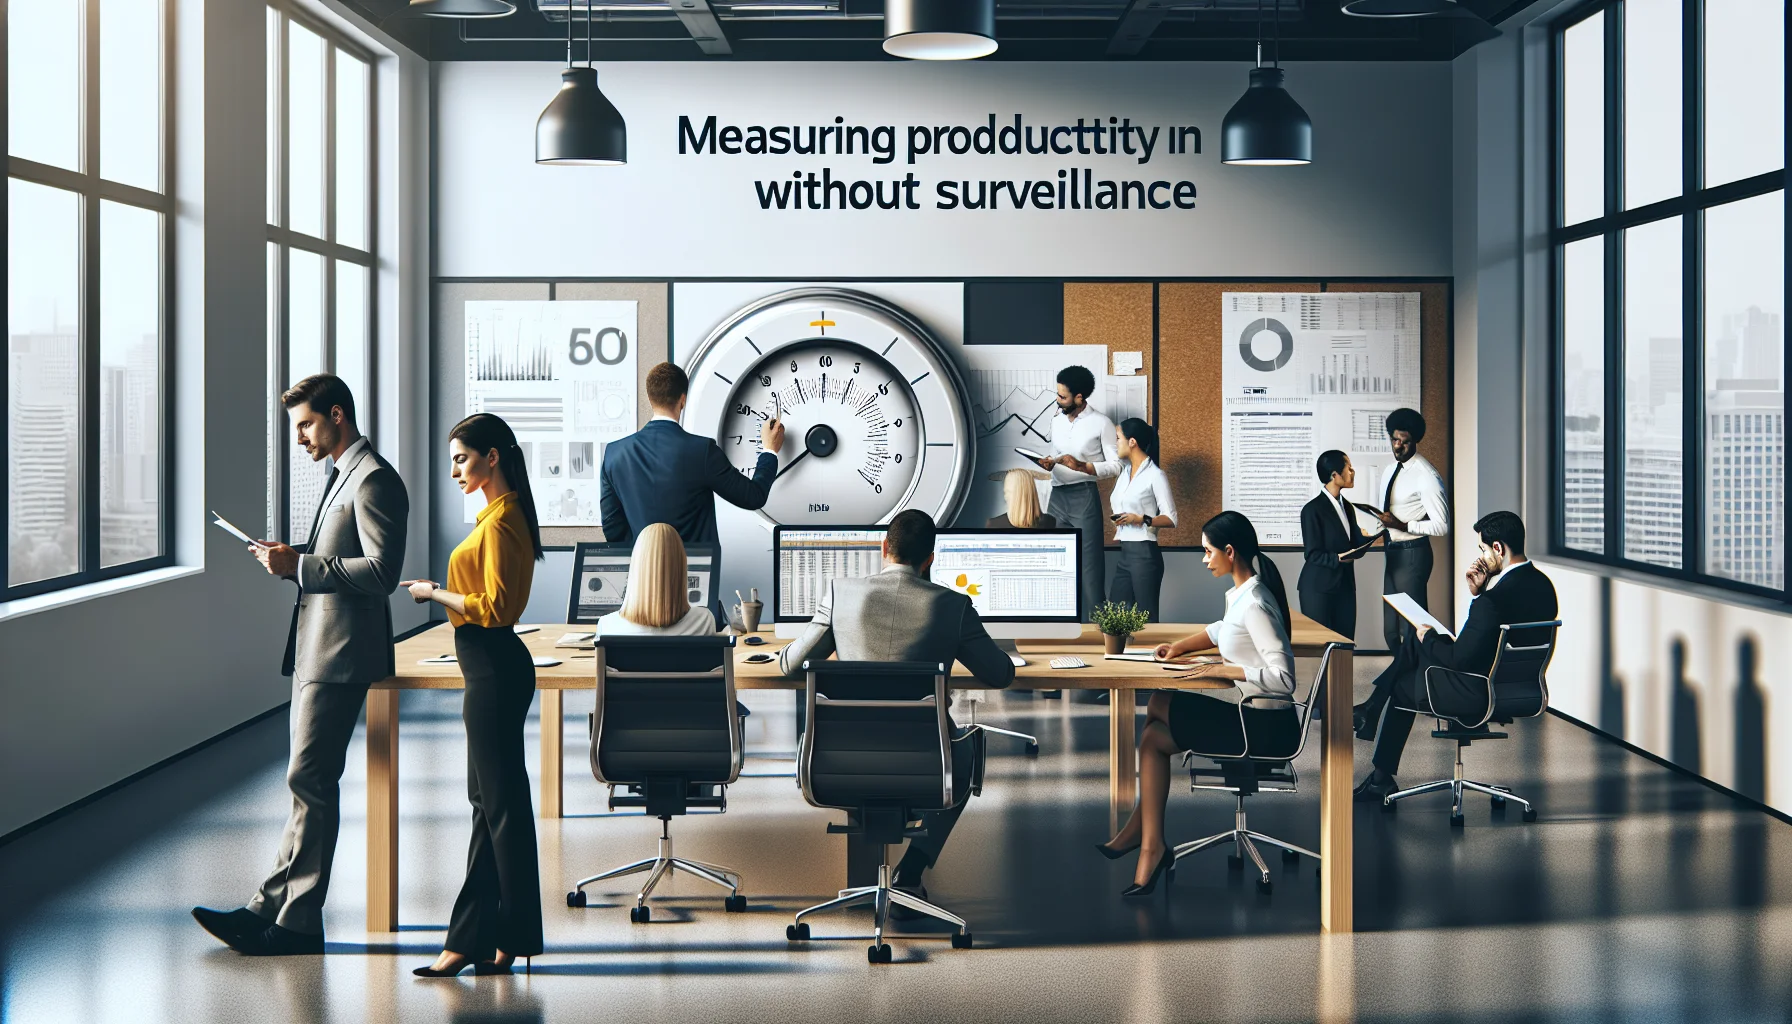
This article presents a results-oriented framework to measure productivity in hybrid teams without surveillance. It recommends KPIs grouped into throughput, cycle time, quality and engagement, a non-invasive dashboard layout, measurement cadences, and guardrails to protect trust. Follow a six-step roadmap and run a six-week pilot.
To sustainably measure productivity hybrid teams, managers must prioritize outcomes over inputs and avoid surveillance that erodes trust. In our experience, successful leaders shift the conversation from "who sat at their desk" to "what value was delivered." This article outlines a balanced framework that favors results-oriented metrics and non-invasive approaches while giving concrete tools you can implement immediately.
We’ll cover a clear KPI taxonomy, a sample dashboard, measurement cadences, practical guardrails to prevent micromanagement, and ethical considerations HR teams should track.
When you measure productivity hybrid teams, choose KPIs that reflect work flow and impact rather than activity proxies. The taxonomy below groups metrics into four reliable categories: throughput, cycle time, quality, and engagement.
We’ve found that mapping work types (projects, tickets, client deliverables) to these categories prevents one-size-fits-all mistakes and helps managers avoid invasive tracking.
Throughput measures finished units of work per time period. Good throughput metrics answer the question: is the team delivering the expected volume?
Throughput is central when you want to measure productivity hybrid without turning to keystroke or screen-time tools.
Cycle time measures speed: how long from start to finish. Pair cycle time with throughput to spot bottlenecks and capacity issues.
Monitoring cycle time lets you test process changes without surveilling individuals; you measure the process, not the person.
Quality anchors output to business impact. Quality metrics reduce gaming and align hybrid teams to customer outcomes.
Quality metrics ensure your effort translates into value and help you measure productivity hybrid in a way that protects product standards.
Engagement metrics help detect hidden risks like burnout, not to punish but to support. Combine survey pulse data with objective signals like meeting load.
These metrics give context when you measure productivity hybrid and help diagnose why delivery slowed or quality dipped.
A concise dashboard should answer four questions: What did we ship? How fast are we moving? Is work meeting standards? Are people healthy? A sample layout below balances those needs without invasive tracking.
| Section | Metric | Why it matters |
|---|---|---|
| Throughput | Tasks completed / sprint | Shows delivery cadence and capacity |
| Speed | Average cycle time (days) | Highlights bottlenecks |
| Quality | Defect rate & CSAT | Connects output to customer value |
| Engagement | Pulse score; 1:1 sentiment | Early warning for disengagement |
| Capacity | Planned vs completed effort | Detects overcommitment |
Design the dashboard with non-invasive productivity tracking principles: aggregate data, anonymize where possible, and show trends rather than raw logs.
Front-load indicators that require managerial action: rising cycle time, falling CSAT, or a sustained drop in pulse scores. These should trigger coaching and process reviews, not automatic disciplinary measures.
A practical layout: top-row summary (Throughput, Cycle Time, CSAT), middle-row heatmap for team health, bottom-row drilldowns by squad or project.
Frequency depends on cadence and work type. In our experience, the right rhythm prevents data overload and supports timely decisions.
When you measure productivity hybrid, use a tiered cadence:
Focus on team-level metrics. Individual-level measurement invites surveillance. If individual metrics are necessary for development, use them sparingly in 1:1s with context and consent.
We recommend avoiding daily checks on personal activity; instead, review individual development goals monthly and assess outputs in performance cycles.
To ensure measurement doesn't devolve into surveillance, put clear guardrails in place. These protect trust and preserve psychological safety while yielding actionable insights.
Key guardrails we've applied successfully:
When managers use these guardrails, they can measure productivity hybrid without creating a culture of constant observation. Emphasize coaching actions, not punitive steps, when metrics cross thresholds.
Three common pain points surface when leaders try to measure hybrid productivity: trust erosion, data overload, and false assumptions about remote work visibility. Tackling each requires different tactics.
To rebuild trust, pair metrics with regular qualitative check-ins. We’ve seen teams recover quickly when leaders share data openly and invite feedback on what the numbers mean.
To prevent data overload, apply purpose-driven dashboards: each pane must answer a clear managerial question. Use alerts for exceptions rather than continuous monitoring.
To improve remote visibility without surveillance, favor outputs, event logs (delivery dates, PR merges), and collaboration indicators over screen capture. This is practical non-invasive productivity tracking and aligns with best practices for hybrid teams.
For example, a product team we coached replaced daily activity logs with a weekly outcomes review and a short pulse survey. That combination reduced churn and improved throughput. This process requires real-time feedback (available in platforms like Upscend) to help identify disengagement early and route support where it’s needed most.
Context is essential. A drop in throughput could be due to technical debt work or a strategic pivot. Always pair metrics with qualitative context before taking action.
We recommend a short incident review protocol: when a metric crosses a threshold, gather a 30-minute cross-functional huddle, capture root causes, and decide on process changes or support needs.
Below is a pragmatic roadmap that scales with team maturity and avoids heavy-handed monitoring.
Common pitfalls to avoid: using activity as a proxy for performance, exposing raw individual logs to broad audiences, and confusing correlation with causation.
Implementation tips we've found effective:
Two brief considerations HR teams must address when you measure productivity hybrid:
Measuring hybrid-team productivity requires a deliberate trade-off: you want clarity without surveillance, insight without overload. Our recommendation is to adopt a results-oriented metrics framework anchored in throughput, cycle time, quality, and engagement, surfaced via an aggregated dashboard, and governed by clear guardrails.
Start small: choose one delivery metric and one engagement metric, build a lightweight weekly dashboard, and run a six-week pilot. Use the pilot to refine metric definitions, frequency, and the manager coaching playbook. When you implement, ensure transparency with teams and use data to support, not punish. That approach lets you reliably measure productivity hybrid in a way that preserves trust and improves outcomes.
Next step: Create a one-page metric charter for your team this week—list the 4 KPIs you’ll track, the review cadence, and the actions you’ll take when thresholds are crossed. Use that charter as the foundation for your pilot and governance conversations.
The Upscend Team provides actionable insights on technology and business strategy.
Book a walkthrough and we'll show you how it applies to your own content.
 Workplace Culture&Soft Skills
January 4, 2026
This article proposes a balanced KPI model for measuring deep work effectiveness in hybrid teams, combining focus metrics, work output KPIs, and quality metrics hybrid. It explains non-invasive collection methods (self-reports, ticket metadata, peer reviews), offers a quarterly review template, and a step-by-step pilot to validate impact and avoid gaming.
 HR & People Analytics Insights
January 6, 2026
This article recommends six core KPIs for a workforce skills dashboard—coverage, proficiency distribution, gap-to-demand, internal fill rate, training effectiveness, and time-to-competency. It explains executive and manager views, alert thresholds (e.g., gap >15% & internal fill <25%), drilldown flows to person-level action, and a practical implementation checklist and pilot approach.
 Emerging 2026 KPIs & Business Metrics
January 12, 2026
This article explains how to build a dashboard time-to-belief: define cohort and belief events, pick a lean KPI set (median time-to-belief, adoption rate, activation), and implement SQL/pseudocode and role-based wireframes. It covers filters, alerts, data model best practices, templates, and a 10-step checklist to operationalize measurement.