

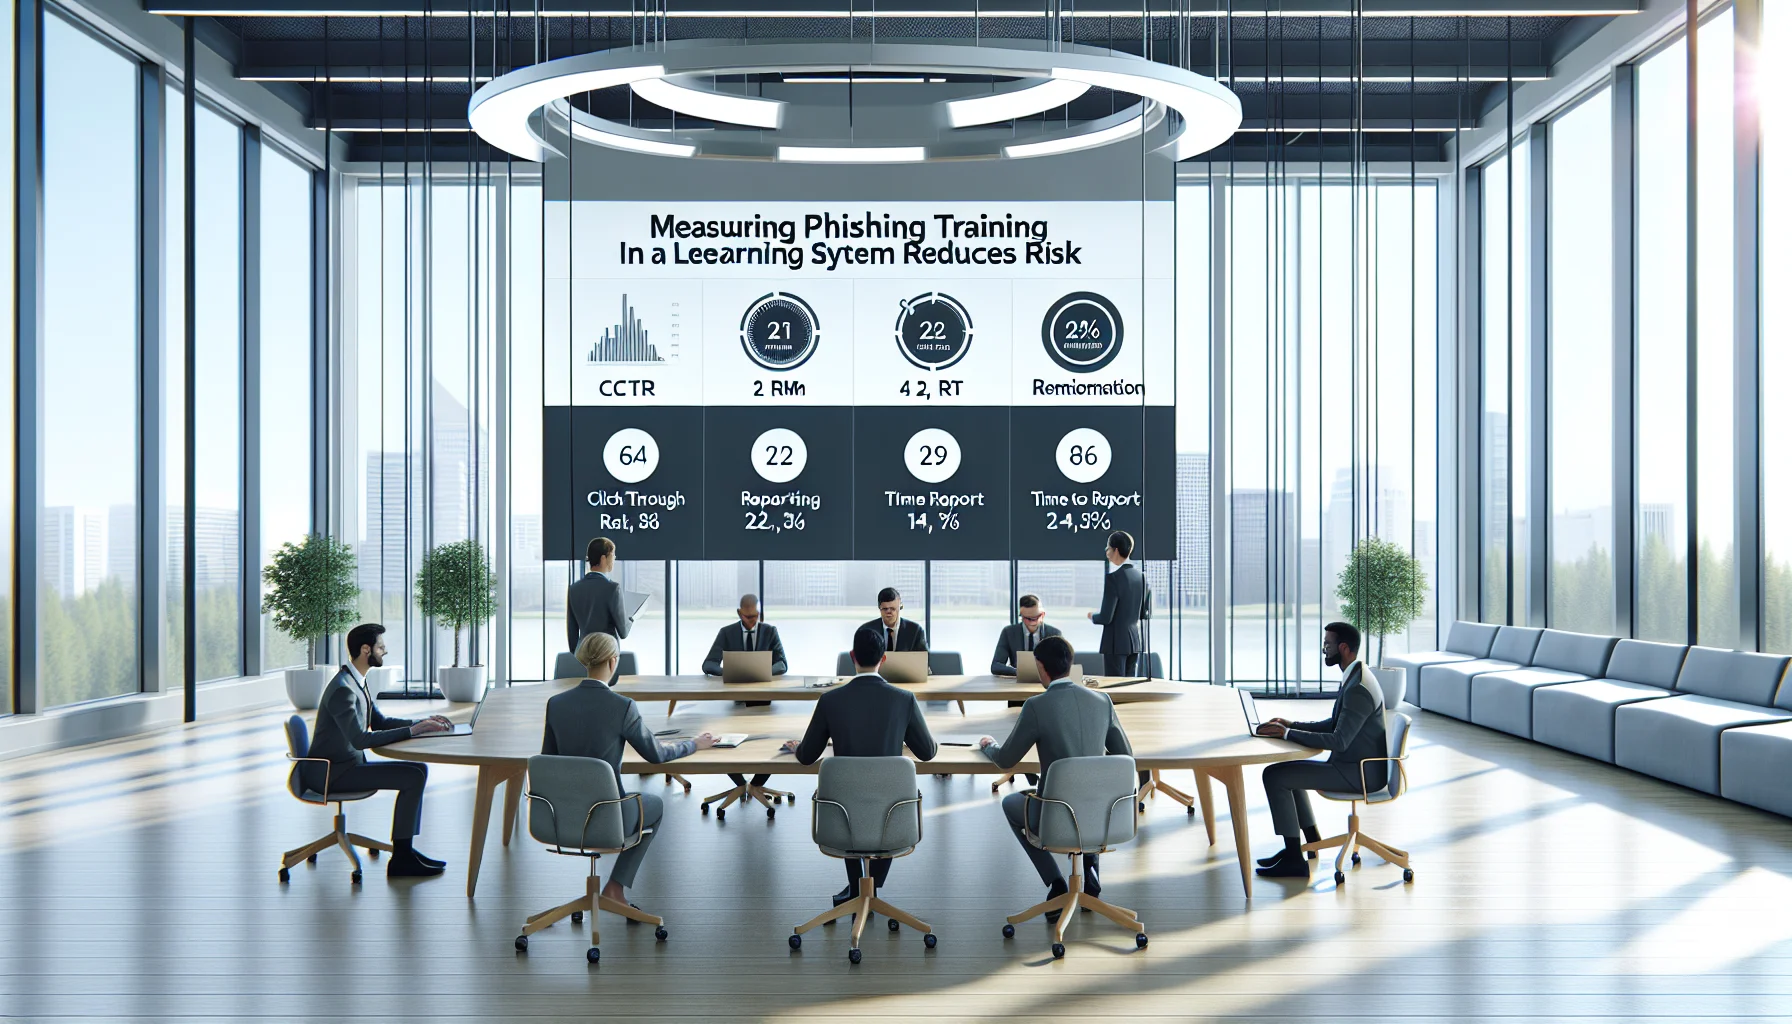
Measuring phishing training relies on five core metrics—CTR, report rate, time-to-report, remediation completion, and repeat offenders—tracked by cohort in an LMS. Use SMART KPIs, dashboards combining simulation and LMS data, and a 90-day plan (baseline, remediation, follow-up) to reduce click rates and speed reporting.
Measuring phishing training is the foundation of an effective security awareness program. In the first 60 words we need clarity: measuring phishing training tells security teams whether simulated attacks produce learning, behavior change, and reduced risk. Without deliberate measurement you get anecdotes, not actionable remediation. This article explains which phishing training metrics matter, how to calculate them, how to avoid misleading signals, and how to present results to executives from an LMS perspective.
Start with a focused set of phishing training metrics: click-through rate, report rate, time-to-report, remediation completion, and repeat offenders. Each metric answers a distinct question about user behavior and program effectiveness.
We've found that prioritizing a few high-signal metrics simplifies analysis and aligns IT, HR, and risk owners.
Click-through rate measures the percent of simulated messages that generated a user click. Calculation:
Track CTR by cohort (department, geography, role) and by template to identify weak spots.
Report rate captures how many users forwarded or reported the phish to the security team. Time-to-report measures lag — how long between delivery and user report.
Both metrics indicate whether users recognize and act on suspicious items, not just whether they click.
When designing KPIs, ask "what behavior changes reduce risk?" That frames measuring phishing training as ongoing risk reduction, not a one-off test. KPIs should be SMART: Specific, Measurable, Achievable, Relevant, Time-bound.
Common KPI phishing simulation choices:
We recommend pairing KPIs with qualitative signals: incident near-misses, helpdesk tickets, and remediation completion. This mix prevents teams from optimizing narrow targets at the expense of true security.
Short answer: the five metrics listed above plus contextual KPIs: phishing susceptibility by role, training completion, and simulated-template effectiveness. Tracking these answers the core question of measuring phishing training—are people learning and changing behavior?
To operationalize measuring phishing training, you need dashboards that combine simulation events with LMS completion and helpdesk data. A concise dashboard should show CTR trend, report rate trend, time-to-report distribution, and remediation completion by cohort.
Practical query examples (pseudo-SQL) to feed dashboards:
In an LMS reporting phishing setup, link simulation IDs to LMS user profiles and completion records so you can correlate clicks with remediation. Many organizations enrich these records with HR attributes for role-level analysis (seniority, department, location).
Dashboards should include filters for timeframe and cohort and a drill-down view showing individual follow-up actions for managers.
Benchmarks vary. According to industry research, baseline CTRs in the first simulation commonly range between 10–30% for large enterprises. High-risk roles (finance, HR) tend to show higher initial CTRs. When measuring phishing training, set staged targets rather than blanket goals.
Suggested benchmark targets:
| Industry/Role | Baseline CTR | 90-day CTR Target |
|---|---|---|
| Finance | 15–25% | Reduce by 40% (to ~9–15%) |
| Engineering/IT | 8–18% | Reduce by 35% (to ~5–12%) |
| General Office | 10–30% | Reduce by 50% (to ~5–15%) |
For ambitious programs aim for click rate reduction of 30–50% in 90 days for cohorts that complete targeted remediation. Remember that absolute targets depend on starting point and threat model.
Focusing solely on raw clicks creates perverse incentives. If the only reported KPI is CTR, teams might run easier simulations or force replay remediation without understanding sustained behavior change. In our experience, the following mistakes are common:
To avoid noisy data and attribution errors, combine signals: a drop in CTR plus increased reporting and shortened time-to-report is a stronger indicator than any single metric. Also validate with incident telemetry: has click-to-compromise decreased?
For practical tooling, integrate LMS completions, simulated event logs, and SOC incident data into a single view (available in platforms like Upscend) so you can triangulate user behavior, remediation progress, and real-world outcomes.
Use longitudinal analysis, cohort controls, and A/B test template difficulty. Success is a sustained reduction in susceptibility and faster reporting, not a single-month dip. Track repeat offenders separately and require targeted coaching or policy interventions for those users.
Operationalize measuring phishing training with a reproducible 90-day plan that includes baseline measurement, intervention, and verification.
Executive reporting should be a one-page dashboard with three KPIs: CTR delta, report rate delta, and median time-to-report, plus one contextual signal (remediation completion or incident reductions). Use charts showing trend and cohort breakdowns for transparency.
Address noisy data by excluding external users and incomplete deliveries and by applying minimum sample-size rules for cohort-level comparisons.
Measuring phishing training is not a compliance checkbox; it's a continuous process that ties human behavior to risk outcomes. By prioritizing a compact set of phishing training metrics, calculating them consistently, and using dashboards that combine LMS reporting phishing data with simulation logs and incident telemetry, teams can demonstrate measurable impact.
Use the 90-day plan to create momentum, focus on meaningful KPIs like CTR, report rate, time-to-report, remediation completion, and repeat offenders, and present results in concise executive dashboards. When you center programs on accurate measurement you move from symbolic training to demonstrable reduction in phishing risk.
Next step: Run a baseline simulation this week, build the three KPI dashboards described above, and schedule a 90-day follow-up to validate progress and refine interventions.
The Upscend Team provides actionable insights on technology and business strategy.
Book a walkthrough and we'll show you how it applies to your own content.
 Business Strategy&Lms Tech
December 31, 2025
Behavior-based phishing simulations adapt templates, timing, and remediation to individual users using role, past behavior, and risk scores. Compared with static campaigns they can cut repeat click rates by 30-60%. Start with a 4–6 week pilot, tune a phishing risk model, monitor repeat clicks and time-to-remediation, and address transparency and fairness.
 Business Strategy&Lms Tech
January 5, 2026
This article maps vetted phishing training content sources — vendor libraries, threat feeds, open-source and free template repositories — and compares costs, licensing and brand-safety steps. It offers a quick-start pack and three DIY recipes to build realistic LMS simulations while minimizing legal and budget risks.
 Business Strategy&Lms Tech
January 5, 2026
This article explains ethical phishing simulations in LMS environments, emphasizing learning over punishment. It provides a practical checklist for governance, scenario design, data handling, escalation rules, tooling criteria, and post-test communication templates. Follow the recommended cadence and cross-functional review to reduce trust erosion and improve measurable security behaviours.
 Technical Architecture&Ecosystems
January 12, 2026
This article explains why LMS migration compliance should be the organizing principle when moving a decade of learner records. It covers applicable laws (GDPR, FERPA, HIPAA), technical controls—encryption, pseudonymization, RBAC—and governance steps: data mapping, consent management, audit logs, a compliance checklist, and a short legal review template for a 30–90 day pilot.