


This playbook shows L&D how to measure psychological safety using a mixed-methods strategy: validated surveys, targeted qualitative inquiry, and behavioral metrics. It provides sample survey items, KPI dashboard examples, and practical designs for attribution like staggered rollouts and control groups. Start with a short pulse and a 3‑month pilot to validate impact.
Measuring psychological safety is the most direct way L&D leaders can show impact on team dynamics, learning transfer, and innovation. In our experience, organizations that make measurement part of program design move beyond anecdotes to demonstrable outcomes. This playbook explains how to design a measurement strategy that combines quantitative surveys, qualitative inquiry, behavioral metrics, and KPI dashboards so L&D evaluation produces credible evidence of change.
Below you'll find a step-by-step approach to implementing robust systems for measuring psychological safety, recommended survey instruments, sample items, behavioral indicators, an example dashboard, and strategies to solve common problems like low response rates, privacy concerns, and attribution.
Learning programs aimed at inclusion, feedback, and leadership habits aim to increase speaking-up, error reporting, and cross-functional collaboration — exactly the behaviors anchored in psychological safety. Measuring psychological safety turns those aims into measurable objectives, which is critical for rigorous L&D evaluation and budget justification.
We've found that linking interventions to specific psychological safety metrics (for example, frequency of idea submissions or number of constructive challenges during retrospectives) makes it easier to show ROI. Industry research shows teams with higher psychological safety perform better on innovation and retention metrics, giving L&D a seat at the table during strategic planning.
Key benefits of formal measurement include clearer program goals, improved learning transfer, and faster iteration on content and delivery. Below are core outcomes to track:
When asking how to measure psychological safety in teams, combine standard psychometric tools with behavioral and operational data. Relying on a single method creates blind spots; triangulation provides stronger evidence. Measuring psychological safety should be tied to both perception data (surveys) and observed behavior (metrics).
Start with these three pillars for measurement:
For L&D teams, the question “how to measure psychological safety in teams” often means designing measures that are sensitive to program-level change within 3–6 months while remaining robust enough for long-term trend analysis. Below we'll present practical instruments and sample items you can deploy immediately.
For reliable L&D evaluation, use validated survey scales plus tailored items that reflect your context. A pattern we've noticed is that short, repeatable batteries produce higher response rates and clearer trend signals than long, one-off questionnaires. Measuring psychological safety regularly enables pre/post comparisons and cohort tracking.
Recommended survey instruments:
Sample survey questions psychological safety (ready to copy):
Psychological safety metrics to pair with surveys:
For L&D metrics for psychological safety programs, map each program objective to one survey item and one behavioral metric. That dual mapping strengthens L&D evaluation and speaks directly to stakeholders.
Qualitative methods illuminate why numbers move. In our experience, combining short anonymous interviews with facilitated focus groups provides rich context without overwhelming analysis time. Use structured prompts to keep findings comparable across teams.
Suggested qualitative prompts:
Behavioral indicators are powerful because they represent acted intent rather than stated comfort. Track indicators such as:
When building an L&D KPI dashboard, combine metrics into a concise view that executives can interpret quickly. A simple dashboard should show baseline, current value, % change, sample size, and confidence notes. Below is an example layout you can implement in your BI tool:
| Metric | Baseline | Current | % Change | Notes |
|---|---|---|---|---|
| Psychological safety score (survey) | 3.2/5 | 3.8/5 | +18.8% | n=210, p<0.05 |
| Error reporting rate | 4.1/1000 hrs | 5.9/1000 hrs | +44% | Higher reporting indicates safer culture |
| Idea submissions | 12/mo | 28/mo | +133% | Cross-team hackathon launched |
Visualization tips: use trend lines for survey score, bar charts for participation, and heat maps to highlight teams with low safety. A balanced dashboard will include both perception and behavioral measures so L&D evaluation captures full program impact.
While traditional systems require manual mapping of learning paths, modern learning and analytics tools can automate sequencing and track behavior across platforms; Upscend illustrates this trend by aligning role-based learning flow with activity data to surface behavioral signals that complement perception surveys.
Attribution is the hardest part of L&D evaluation for psychological safety. We've found that a mix of design choices improves causal inference: clear baselines, staggered rollouts, and matched control groups where feasible. Measuring psychological safety without these creates risk that reported changes reflect unrelated organizational shifts.
Design options to strengthen attribution:
Analytic techniques that help attribution:
Practical tip: always report sample sizes, effect sizes, and confidence intervals. Decision-makers value transparent limitations over overstated claims.
Implementing a full measurement program for psychological safety typically follows a three-phase timeline: baseline & design, deployment & monitoring, and evaluation & iteration. Below is a suggested 9-month timeline you can adapt.
Data privacy and ethical considerations are non-negotiable. Protect anonymity for small teams, aggregate data for reporting, and limit access to raw responses. We recommend a privacy checklist:
Common pitfalls and how to avoid them:
Measuring psychological safety must be sustainable. Keep survey batteries concise, automate dashboards, and schedule recurring qualitative checks. In our experience, teams that commit to a measurement cadence (monthly pulses + quarterly deep dives) get reliable signals without overwhelming respondents.
Measuring psychological safety is tractable when L&D combines validated surveys, targeted qualitative inquiry, and behavioral metrics into a coherent evaluation strategy. Use baseline data, appropriate control designs, and a clear KPI dashboard to make the case for program impact. Report both perception improvements and behavior changes — together they tell a credible story.
Operationalize the playbook by starting small: launch a focused pulse survey and one behavioral indicator, create a simple dashboard, and run a staggered pilot. Iterate based on what the data reveal. We've found that transparent methods, thoughtful privacy protections, and clear attribution strategies turn measurement from a compliance exercise into a growth engine for culture.
Next step: pick one team to pilot a 3-month measurement cycle using the sample survey items and dashboard template above; review results with stakeholders and scale what works. This pragmatic approach to measuring psychological safety will let you show L&D evaluation impact with rigor and speed.
The Upscend Team provides actionable insights on technology and business strategy.
Book a walkthrough and we'll show you how it applies to your own content.
 Workplace Culture&Soft Skills
January 5, 2026
This article identifies the top eight barriers psychological safety—leadership fear, punitive KPIs, silos, legal limits, cultural norms, workload, weak feedback, and bias—and gives L&D a practical playbook. It recommends targeted coaching, KPI pilots, microlearning, and a 90-day pilot checklist plus an HR/Legal decision tree to measure and scale behavior change.
 Workplace Culture&Soft Skills
January 5, 2026
This article shows how to embed psychological safety into performance reviews through behavior-based competencies, calibrated feedback, paired outcome+process KPIs, and targeted recognition. It provides sample competency descriptors, calibration rules, two brief case studies, and a six-month implementation checklist so L&D and HR can pilot and scale evidenced alignment.
 Workplace Culture&Soft Skills
January 5, 2026
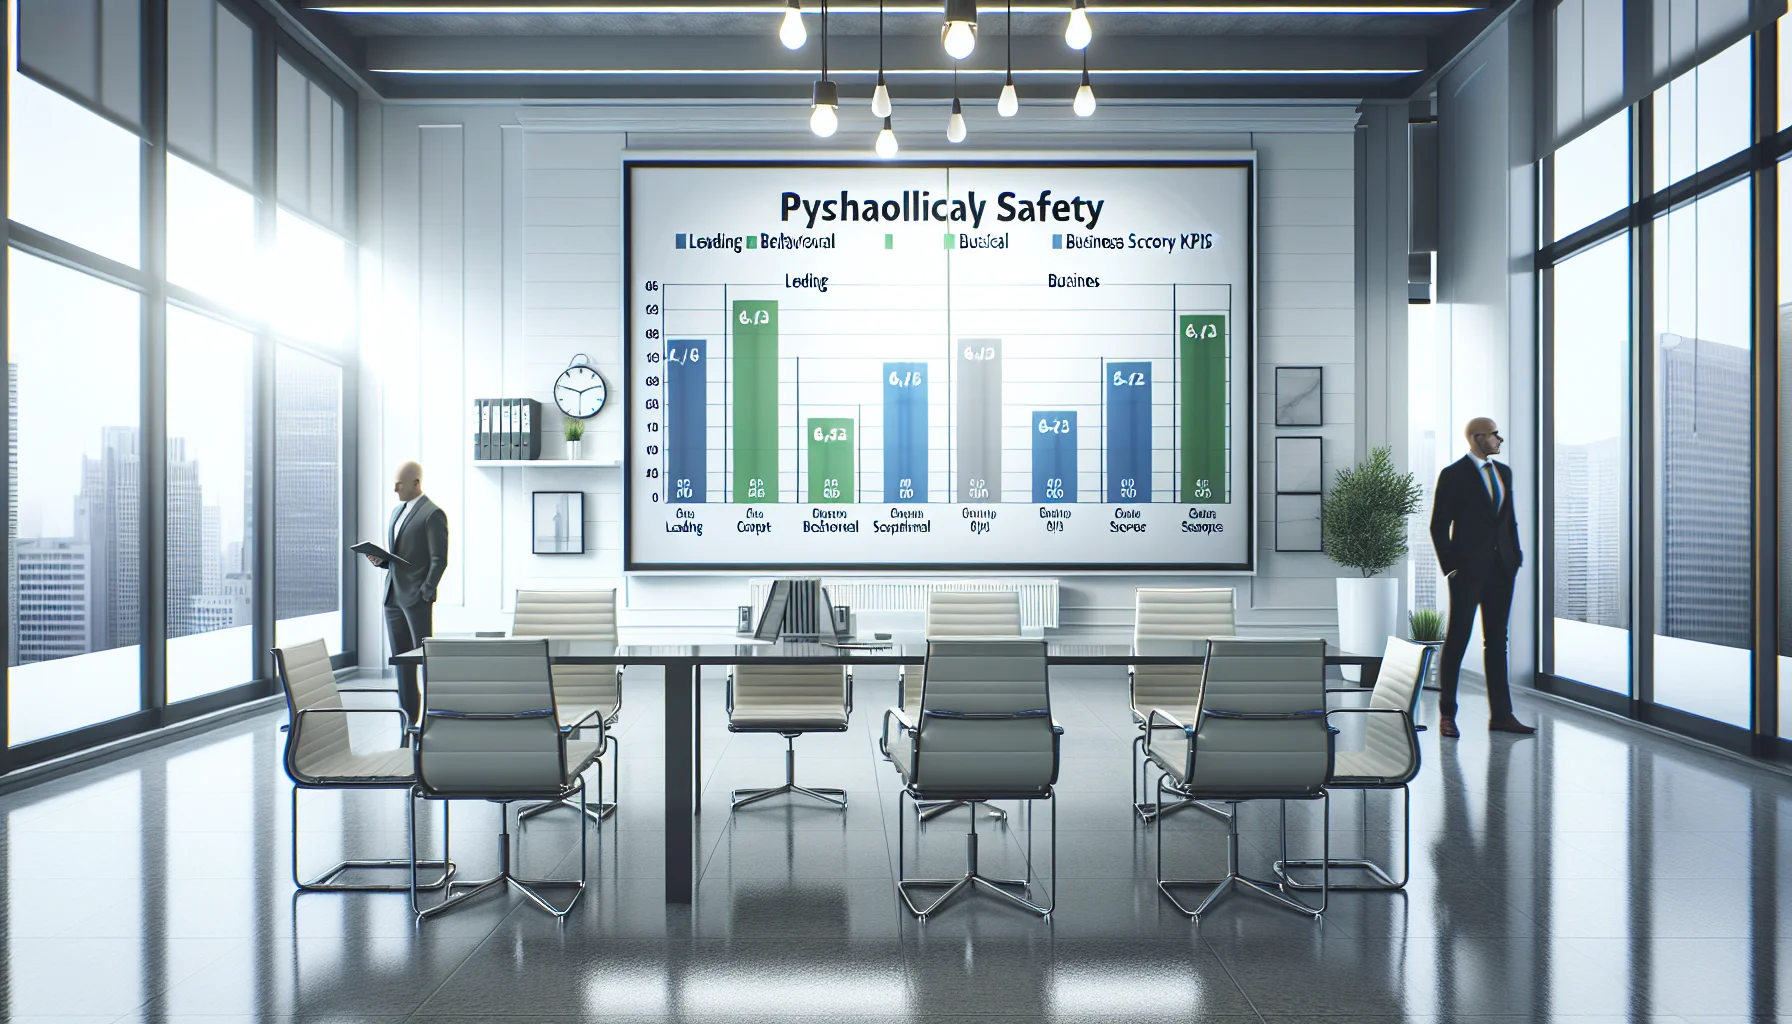
This article presents a balanced scorecard of psychological safety KPIs—leading, behavioral, and business outcomes—and gives operational formulas, baselines, and a sample quarterly dashboard. It explains converting changes into dollar impacts, handling attribution (difference‑in‑differences, staged rollouts), and an implementation checklist to run a 90‑day pilot and measure L&D ROI.
 Workplace Culture&Soft Skills
January 5, 2026
This article presents four psychological safety case study examples where L&D led programs across small, mid-market, and enterprise settings. It outlines objectives, step-by-step implementations, common challenges, measurement approaches, and outcomes — showing repeatable playbook elements, scaling strategies, and a practical checklist for piloting and measuring impact.