


This article presents a repeatable ROI framework for centralized hotel staff apps: map costs, quantify benefits, model timing and sensitivity. It lists cost categories, measurable benefit streams, and a conservative 10,000-staff sample showing strong payback. Use the downloadable spreadsheet to run base, downside and upside cases for CFO review.
When hospitality leaders evaluate a centralized staff app, the key lens is hospitality platform ROI. Framing decisions with a repeatable ROI model converts abstract benefits into numbers executives approve. This article provides a practical framework to calculate ROI of a hotel staff mobile platform, lists cost categories and benefit streams, shows a concise sample for a 10,000-staff organization, and ends with sensitivity and break-even analysis you can apply.
Treat a platform as a business investment, not a feature purchase. Map lifecycle costs and measurable benefit buckets, then run conservative and aggressive scenarios. Build a four-part model: costs, benefits, timing, and sensitivity.
Key principles: align savings to P&L (labor, revenue, guest recovery), attribute improvements to workflows, and track on a consistent cadence (monthly or quarterly). Industry benchmarks commonly show 0.5–2% uplift in ADR/RevPAR when guest-facing workflows are standardized and upsell capture is consistent; that relationship underpins a robust hospitality platform ROI case.
Operationalize by agreeing baselines pre-launch: average ticket handle time, baseline ADR and occupancy, and complaint/recovery rates. Baselines let you measure deltas quickly and iterate on the investment case for mobile hub projects.
Accurate modeling requires a complete cost inventory. Missing costs undermines credibility. Include:
Capture capitalized one-time costs and recurring operating costs. Model a realistic ramp—typical rollouts reach steady-state usage over 6–9 months; that ramp affects both costs (training hours) and benefits (delayed efficiency gains), altering your projected hospitality platform ROI.
Device and security choices matter: BYOD reduces capital but increases MDM and compliance work; company-owned devices simplify support and can improve adoption. Use TCO hotel staff app calculations to compare lifetime costs across vendor models.
TCO hotel staff app extends licenses into a multi-year view. Include device depreciation, renewal inflation, and integration staffing or outsourcing. Amortize one-time implementation/integration over 3–5 years and model SaaS renewal inflation (2–5%). This makes vendor comparisons apples-to-apples and clarifies the cost benefit hospitality tech delivers over the lifecycle.
Benefits align to four measurable streams: labor efficiency, revenue uplift, guest recovery and retention, and operational risk reduction. Track minutes saved per task, incremental ADR, complaint reductions, and attrition improvements.
Secondary but meaningful benefits: improved audit trails for compliance, faster incident resolution limiting negative reviews, and cross-property knowledge sharing that shortens training. These are harder to quantify but accumulate materially.
Sample calculation (conservative assumptions) for a 10,000-staff organization:
| Line item | Assumption | Annual impact |
|---|---|---|
| Licenses | $40 per user / year | $400,000 |
| Integrations & implementation (one-time) | $600,000 year 1 | $600,000 |
| Training & change | Avg 4 hours per staff @ $15/hr | $600,000 |
| Maintenance & devices | $20 per user / year | $200,000 |
| Total annual cost (yr1) | $1,800,000 | |
| Labor savings | 5 min/day saved per employee (~$13/day) | $33,250,000 |
| Revenue uplift | 0.5% ADR uplift on 100,000 rooms @ $150 ADR | $75,000 |
| Reduced complaints/fees | 20% fewer recoveries (~$250k) | $50,000 |
| Total annual benefit | $33,375,000 |
In this conservative model, implied hospitality platform ROI exceeds 18x in year one (benefit/cost). The dominant driver is aggregated per-employee time savings. Adjust minutes saved, wage rates, or adoption to see material change.
Some efficient L&D teams automate training workflows—linking completion to operating metrics improves the investment case for mobile hub tools by making gains auditable.
Use a simple formula: (NPV of Benefits - NPV of Costs) / NPV of Costs = ROI. Discount multi-year benefits at your corporate WACC (or a conservative 8–12%). Always model a base case and a downside case where adoption or time-savings are 50% of expectations. This enhances credibility with finance.
Amortize one-time implementation and integration costs over the expected solution life (3–5 years) and include device depreciation in TCO. Present both nominal and NPV figures so stakeholders see undiscounted annual cashflow and discounted economics.
Break-even hinges on upfront integration/training costs and ramp to steady-state benefits. In the sample, if benefits start evenly at month six, payback is under three months after steady-state, but realistic enterprise adoption often stretches payback to 6–9 months.
Quick payback generally comes from labor efficiency and churn reduction; revenue uplift compounds over time but is less reliable short-term.
Run sensitivity across three variables: adoption rate (% active users), minutes saved per user, and wage rate. Change each ±25% and observe ROI delta. Typical findings:
Report break-even in months and show cumulative cashflow for base, downside, and upside scenarios. Include KPI milestones (e.g., 30-day adoption, 90-day time-saved) that trigger next-stage rollouts or additional investment. This transparency addresses executive questions and sets realistic expectations for hospitality platform ROI.
To secure executive buy-in, translate operational benefits into P&L and cashflow effects. Effective tactics:
Rollout tips: use microlearning (2–5 minute modules), incentivize early adopters, and embed product champions at each property. Set a governance cadence—biweekly during launch, then monthly—to resolve blockers quickly.
Common pitfalls:
Focus on auditable metrics: payroll reductions, reduced agency spend, fewer refunds, and headcount avoidance. Tie each metric to a ledger or operational report. Provide conservative and best cases, make assumptions explicit, and supply a downloadable model finance can adjust (wage rates, adoption, discount rate). That model is often the final step to approval.
Checklist for CFO-ready documentation:
We recommend packaging a downloadable ROI spreadsheet template with fields for cost categories, benefit streams, and sensitivity toggles. Include pre-built cumulative cashflow and payback charts and suggested data sources for each input to validate the cost benefit hospitality tech case.
Calculating hospitality platform ROI requires discipline: include full costs (licenses, integrations, training, maintenance), map benefits (reduced churn, higher ADR, labor efficiency, fewer complaints), and model timing and sensitivity. A repeatable model converts operational anecdotes into finance-acceptable forecasts and secures executive buy-in.
Key takeaways:
Next step: download the ROI spreadsheet template, populate it with your wage rates, adoption targets, and device costs, and run a three-year base and downside case. Use the template to prepare a 90-day pilot with clear KPIs for leadership. That pilot is often the fastest route to proving value and securing budget.
Action: Build the ROI model, run sensitivity scenarios, and prepare a one-page executive summary showing NPV, payback months, and the most sensitive assumption. Properly modeled, your cost benefit hospitality tech case will show both immediate savings and the longer-term strategic value of savings from standardization and cost savings from service standardization.
The Upscend Team provides actionable insights on technology and business strategy.
Book a walkthrough and we'll show you how it applies to your own content.
 Business Strategy&Lms Tech
January 22, 2026
This article provides a prioritized 15-item hospitality vendor checklist to evaluate enterprise hospitality hubs. It covers core functionality, integrations (PMS/CRM/HRIS), security and offline behavior, implementation, SLA/pricing, a weighted scoring model and an RFP question bank. Use standardized demos and pilots to validate vendors and reduce time-to-value.
 Business Strategy&Lms Tech
January 22, 2026
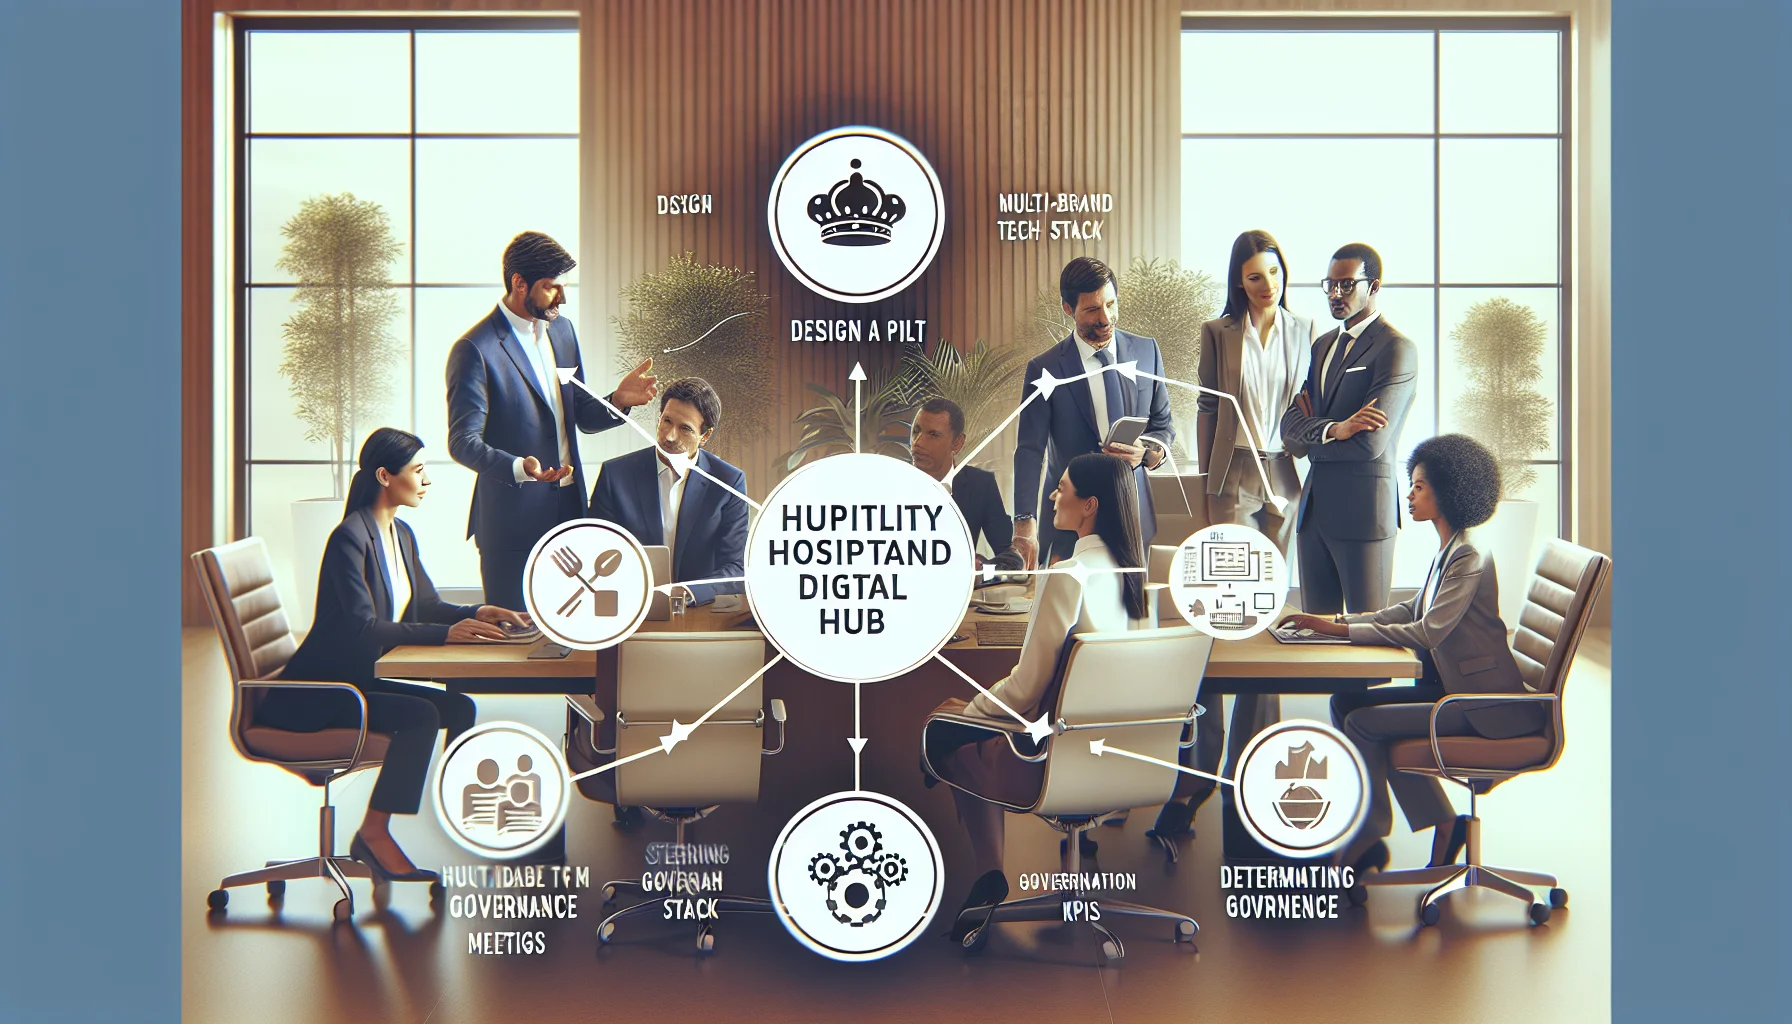
This blueprint guides hotel groups through a 90–120 day pilot to deploy a hospitality digital hub across multiple brands. It covers objectives, stakeholder RACI, pilot MVS, canonical data models, integration patterns, KPIs and training tactics. Readers will learn measurable targets, governance checkpoints and a repeatable rollout plan to scale with minimal brand disruption.
 Business Strategy&Lms Tech
January 22, 2026
This playbook gives a four-phase approach—Prepare, Pilot, Scale, Sustain—to drive adoption of a centralized staff mobile hub across 10,000+ hotel employees. It includes sponsor alignment templates, champion training tactics, regional scaling plans, KPIs, and a risk register, with targets like 70–85% weekly active usage within three months.
Business Strategy&Lms TechJanuary 22, 2026
This guide explains how procurement, operations and IT teams can find and evaluate enterprise mobile platforms for hospitality quality control mobile workflows. It covers solution types (SaaS, white-label, bespoke), evaluation criteria, an RFP question bank, pricing/TCO modelling, pilot design, and common pitfalls with mitigation.