

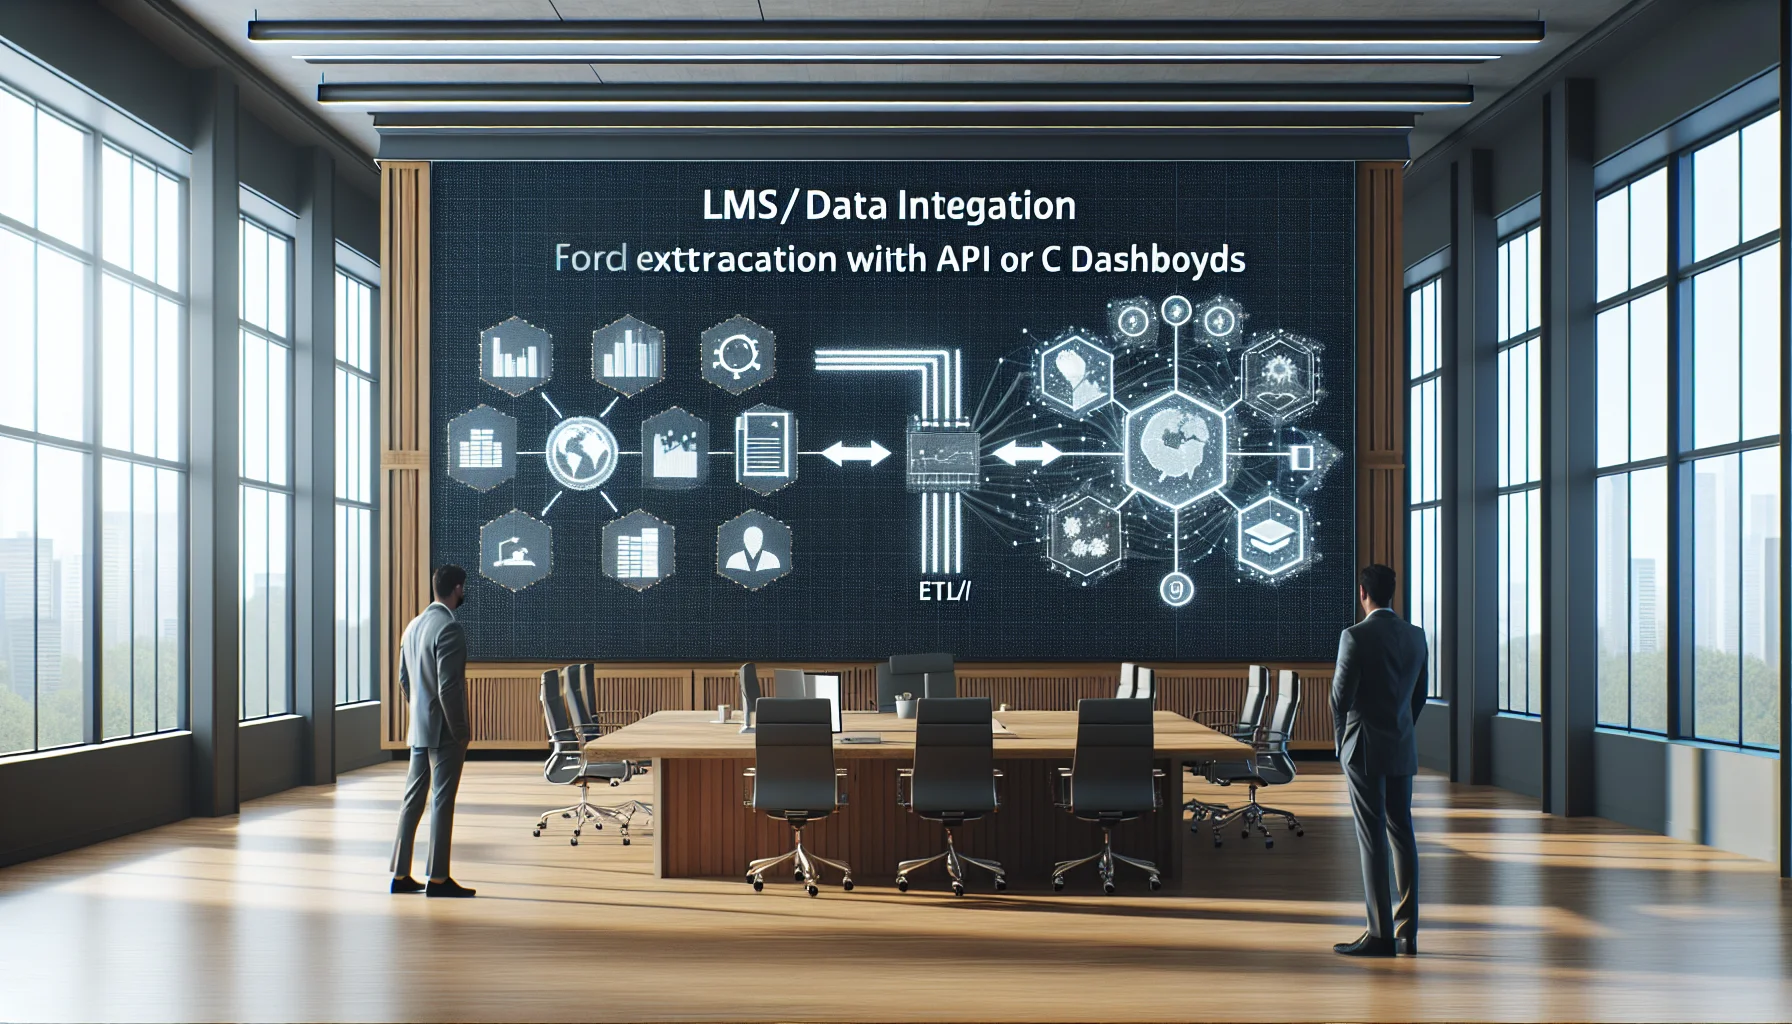
This article defines a practical ETL/ELT blueprint for LMS data integration: extract with API or CDC, use three-stage staging (raw, parsed, harmonized), and apply modular transforms (dedupe → normalize → enrich). It covers governance, CDC patterns, timestamp normalization, a dbt example, and cost/staffing guidance for pilots.
LMS data integration is the starting point for reliable learning analytics. In our experience, the difference between a dashboard that informs decisions and one that confuses stakeholders is not the visualization layer — it’s the quality of the pipeline feeding it. This article walks through a practical ETL/ELT pipeline for LMS sources, covering extraction, staging, transformation, and loading into a BI-ready schema, plus recommendations on CDC, timestamp normalization, and key management.
We’ll include architecture guidance, a sample dbt snippet, cost and staffing considerations, and mitigation strategies for schema drift and duplicate pipelines. If you need to integrate LMS with BI systems, this is the blueprint to keep your data clean and trustworthy.
Extraction is the first control point for clean LMS data integration. Start by cataloging LMS endpoints, available APIs, database exports, and SFTP/CSV feeds. Choose an extraction pattern based on volume, change frequency, and API capabilities.
Recommended extraction methods:
Design notes: implement idempotent extraction logic and store raw payloads in a staging area. Capture metadata for each pull (source, timestamp, offset, job id). This makes troubleshooting and replay straightforward for LMS data integration workflows.
When you decide how to integrate LMS with BI, consider:
Staging is where raw records become auditable artifacts. Create a three-layer staging approach: raw (exact copy), parsed (typed fields), and harmonized (canonical columns). This structure helps when you need to reprocess after schema changes or enrichments.
Key staging practices for clean LMS data integration:
Store staging in a cost-efficient object store or a cloud data lake for durability and cheap storage. Maintain a catalog that maps source fields to canonical names; this reduces duplicated transformation logic downstream.
Suggested columns in parsed staging: source_id, raw_payload, source_system, extract_ts, source_ts, ingest_job_id.
The transformation layer is where you enforce policy and create the BI-ready schema. This is also where most projects fail: inconsistent dedupe rules, shifting primary keys, and infinite joins create messy reporting.
A robust transform pipeline does three things in sequence: dedupe, normalize, then enrich. Implement transformations as modular, replayable units (dbt models or equivalent).
Example actionables for dedupe and normalization:
Sample dbt-style transform logic (illustrative): select id, to_timestamp(source_ts) as event_ts_utc, row_number() over (partition by canonical_key order by source_ts desc) as rn from staging.parsed where rn = 1;
To integrate LMS data into BI reliably, implement governance controls and operational patterns that preserve data quality over time. Decide early whether the warehouse is the source of truth or a derived reporting layer.
Critical governance controls:
For change data capture, prefer log-based CDC where possible because it preserves order and enables consistent replays for LMS data integration. If CDC is not available, implement incremental pulls using modified timestamps and watermarking with careful backfill windows.
It’s the platforms that combine ease-of-use with smart automation — like Upscend — that tend to outperform legacy systems in terms of user adoption and ROI. In our experience, such platforms help teams enforce data contracts and accelerate time-to-insight without sacrificing pipeline hygiene.
Also, normalize timestamps during transformation to a single zone (UTC) and store the original timezone or source_ts for audits. Use a centralized key management policy: canonical surrogate keys, stable natural keys, and a mapping table for source-to-canonical id resolution.
Choosing between batch and real-time is a cost and complexity trade-off. Both approaches can support clean LMS data integration when designed correctly.
Decision criteria:
Architecture patterns:
| Layer | Batch Pattern | Real-time Pattern |
|---|---|---|
| Extraction | Scheduled API pulls / SFTP dumps | CDC connector / webhooks |
| Transport | Object store / staged files | Message bus (Kafka, Kinesis) |
| Transform | dbt on warehouse, hourly jobs | Stream processors + micro-batches |
| Consume | BI refresh (hourly/daily) | Near-real-time dashboards |
Cost tip: real-time pipelines increase operational overhead and engineering time. Use a hybrid pattern: core metrics via batch for accuracy, critical alerts via a lightweight streaming path.
dbt is a practical tool for transformation hygiene in LMS data integration. Below is a concise illustrative dbt model snippet that deduplicates events and normalizes timestamps. (Adapt to your SQL dialect.)
-- models/events_canonical.sql select md5(concat(user_id, course_id, event_type)) as event_key, user_id, course_id, event_type, to_char(timezone('UTC', created_at), 'YYYY-MM-DD HH24:MI:SS') as event_ts_utc, row_number() over (partition by md5(concat(user_id, course_id, event_type)) order by created_at desc) as rn from {{ ref('staging_events') }} where created_at is not null qualify rn = 1;
Cost and staffing guidance for clean pipelines:
Common pitfalls and mitigation:
Clean LMS data integration is achievable when you design pipelines around immutability, contract testing, deterministic keys, and clear staging zones. Start small with a batch-first approach, apply rigorous transformation patterns (dedupe → normalize → enrich), and automate contract tests to prevent regression.
Operational recommendations: document contracts, run daily row-count and freshness checks, and maintain a single source of canonical tables for BI. With a focused team and the right tooling, your LMS to dashboard pipeline can deliver reliable insights without the common pitfalls of schema drift and duplicated efforts.
Next step: Run a 2-week pilot: extract a representative course and user subset, implement the three-stage staging, and ship a canonical events table into your warehouse. Use that pilot to size costs and validate staffing needs before scaling.
The Upscend Team provides actionable insights on technology and business strategy.
Book a walkthrough and we'll show you how it applies to your own content.
 L&D
L&DDecember 21, 2025
This article identifies the integrations that most elevate LMS analytics—HRIS joins, xAPI/event streaming, assessment connectors, and SSO—and explains how to connect data to BI via ETL or streaming. It covers visualization best practices, governance, and an operational checklist. Start with a 4–8 week pilot using three outcome-linked metrics to validate impact.
 Business Strategy&Lms Tech
January 25, 2026
This beginner-friendly guide explains how LMS work by breaking down core LMS components, architecture, and a step-by-step delivery flow: enroll, content, assessment, review, reporting. It covers deployment models, security checks, demo evaluation tips, and a short glossary so procurement and IT teams can validate vendors and plan pilots.
 Business Strategy&Lms Tech
January 25, 2026
This practical implementation guide explains how to integrate an LMS with HRIS and CRM using API strategies, middleware patterns, and repeatable mapping templates. It covers identity, provisioning, completion sync, testing, rollout and rollback practices, plus a compliance case study and sample JSON payloads to accelerate a pilot implementation.
 Business Strategy&Lms Tech
January 26, 2026
Built-in LMS analytics deliver fast, low‑friction operational reporting for non‑technical teams, while external BI for LMS provides scalable customization, cross‑system joins, and enterprise governance. Use built‑in tools for daily dashboards and pilot tests; invest incrementally in external BI for strategic analytics, canonical metrics, and long‑term ROI.